<?xml version="1.0" encoding="UTF-8"?>
<feed xmlns="http://www.w3.org/2005/Atom" xml:lang="en-US">
                        <id>https://www.valuethemarkets.com/feed/analysis/investing-ideas</id>
                                <link href="https://www.valuethemarkets.com/feed/analysis/investing-ideas" rel="self"></link>
            <link rel="hub" href="https://pubsubhubbub.appspot.com/" />
                                <title><![CDATA[Investing Ideas]]></title>
                                <logo>https://www.valuethemarkets.com/images/logo-dark.png</logo>
                                <subtitle>Explore investing ideas with in-depth guides on emerging trends, high-potential sectors, and market opportunities to help you discover your next investment move.</subtitle>
                                                    <updated>2026-06-10T11:08:33+00:00</updated>
                        <entry>
            <title><![CDATA[Oil and Gas Reserves: What Investors Need to Know]]></title>
            <link rel="alternate" href="https://www.valuethemarkets.com/analysis/investing-ideas/challenge-finding-high-quality-oil-gas-reserves" />
            <id>https://www.valuethemarkets.com/34645</id>
            <author>
                <name><![CDATA[Patrick Davis]]></name>
                        <email><![CDATA[naz.shamlian@digitonic.co.uk]]></email>
                    </author>
            <summary type="html">
                <![CDATA[A global shortage of high-quality oil and gas reserves is reshaping the energy sector. Here is what retail investors need to understand about supply, prices, and stocks.]]>
            </summary>
                        <content type="html">
                <![CDATA[
                                        <p><a href="https://www.valuethemarkets.com/analysis/investing-ideas/challenge-finding-high-quality-oil-gas-reserves"><img alt="Oil and Gas Reserves: What Investors Need to Know" src="https://www.valuethemarkets.com/curator/media/882ab4c0-d32e-450f-87f7-fa4d30b207c2.png?fm=webp&amp;q=80&amp;s=074d290f22f5fec497ef34e2201f46e2" /></a></p>
                                        <p>The oil and gas industry is not running out of resources. It is running out of <em>good</em> ones. That distinction matters enormously to investors. A global surplus of technically recoverable oil and gas reserves coexists with a growing shortage of reserves that are cheap to develop and low enough in emissions to survive tightening regulatory and investor scrutiny. Understanding where that gap sits, and which companies are positioned to bridge it, is one of the most important filters an energy investor can apply right now.</p><h2 id="what-oil-and-gas-reserves-actually-mean"><a href="#what-oil-and-gas-reserves-actually-mean">#</a>What Oil and Gas Reserves Actually Mean</h2><p>In the energy industry, not all reserves are equal. The term &#34;reserves&#34; covers a spectrum: from proved reserves (resources that can be extracted with high confidence under current economic conditions) through to technically recoverable resources that may never be commercially viable.</p><p>The distinction matters because the commonly cited headline figures can be misleading. Worldometers estimates 1.77 trillion barrels of proven oil reserves as of 2025, equivalent to around 47 years of supply at current consumption levels (sourced from BP and EIA data)<sup>1</sup>. But those figures include large volumes that are either too expensive to extract, too carbon-intensive to develop under current policy frameworks, or located in places that lack the infrastructure to bring them to market. The investable universe is considerably smaller than the geological one.</p><p>When analysts and investors talk about a looming shortage of quality oil and gas reserves, they mean a shortage of resources that tick all three boxes at once: low production cost, low emissions intensity, and accessible enough to develop within a commercially meaningful timeframe.</p><h2 id="the-supply-gap-investors-should-understand"><a href="#the-supply-gap-investors-should-understand">#</a>The Supply Gap Investors Should Understand</h2><p>Existing producing oil fields decline naturally over time. Without continuous reinvestment in new fields or enhanced recovery from existing ones, output falls. The near-term picture has been dramatically reshaped by the closure of the Strait of Hormuz following the outbreak of military conflict involving the US, Israel, and Iran in late February 2026. According to the IEA&#039;s May 2026 Oil Market Report, global oil supply has fallen by approximately 12.8 million barrels per day since the start of the conflict, with Gulf output at historically depressed levels<sup>2</sup>. That disruption has exposed just how quickly a structural supply surplus can become a supply crisis. The longer-term challenge facing the upstream sector is that the pool of replacement assets with favorable economics and a manageable carbon footprint has been shrinking for years, creating a cumulative gap that becomes material well before 2050.</p><p>Exploration investment dropped sharply through the 2010s and remained suppressed well into the 2020s as capital shifted toward renewables and ESG-driven mandates pulled institutional funding away from new fossil fuel development. The scale of that underinvestment is now measurable. Current onstream fields will deliver only 700 billion barrels of the roughly 1,000 billion barrels needed to meet cumulative liquids demand through 2050, leaving a 300 billion barrel shortfall under Wood Mackenzie&#039;s base case scenario, according to Wood Mackenzie analysis published in April 2026<sup>3</sup>. Filling that gap requires either new discoveries or field extensions at a pace the industry has not sustained in recent years.</p><p>Unconventional sources, including shale, deepwater, and Arctic drilling, have partially filled that gap. But these resources typically come with higher breakeven costs and more complex environmental profiles than the conventional fields they are replacing. Tight oil (oil trapped in shale rock formations) delivered a genuine supply revolution, but the era of rapid US shale growth appears to be over. US crude output hit a record 13.5 million barrels per day in mid-2025 before the EIA forecast a decline through 2026, driven by falling rig counts and eroding well productivity in mature basins such as the Bakken and Eagle Ford, according to the EIA&#039;s June 2025 Short-Term Energy Outlook<sup>4</sup>.</p><p>The result is that companies are having to work harder, spend more, and tolerate higher emissions intensity to maintain production volumes that would have been far cheaper to sustain a decade ago.</p><h2 id="why-this-matters-to-investors"><a href="#why-this-matters-to-investors">#</a>Why This Matters to Investors</h2><p>Three dynamics flow from the reserves quality problem, and each carries direct implications for investors in oil and gas stocks.</p><h3 id="profitability-under-pressure"><a href="#profitability-under-pressure">#</a>Profitability under pressure</h3><p>The world&#039;s 30 largest E&amp;P companies face production declines averaging nearly 40% between 2025 and 2040, according to Wood Mackenzie&#039;s April 2026 analysis. Higher development costs compound that pressure, compressing margins particularly for companies with portfolios weighted toward technically complex assets. A producer that looked profitable at $70 per barrel when operating conventional fields may struggle to maintain the same returns once it pivots to deepwater or shale development at a higher cost base.</p><h3 id="consolidation-is-accelerating"><a href="#consolidation-is-accelerating">#</a>Consolidation is accelerating</h3><p>When the pool of high-quality assets shrinks, competition for those assets intensifies. That dynamic historically drives mergers and acquisitions as larger players absorb smaller companies to secure reserves. Investors in smaller E&amp;P (exploration and production) companies may benefit from acquisition premiums, while diversified majors can use their balance sheets to build scale. US upstream M&amp;A peaked at around $105 billion in 2024 before declining to approximately $65 billion in 2025 as lower oil prices widened the bid-ask spread and suppressed transaction volumes, according to Enverus data<sup>5</sup>. Activity in 2026 is expected to remain more selective, focused on inventory quality and basin diversification rather than the large transformative deals that defined the 2023 and 2024 cycle.</p><h3 id="divergence-between-operators"><a href="#divergence-between-operators">#</a>Divergence between operators</h3><p>Not all oil and gas companies face the same reserves challenge, and the Hormuz disruption has sharpened that divergence further. Companies with large, long-life, low-cost assets outside the Gulf, including established North Sea infrastructure, West African deepwater positions, and US Atlantic Basin producers, have seen margins improve materially as elevated prices more than offset their cost bases. By contrast, producers whose assets are located within or dependent on Gulf supply chains are contending with severe operational disruption. Investors who treat the sector as homogeneous miss this divergence, which is as wide now as at any point in recent memory.</p><h2 id="how-oil-prices-respond-to-reserve-quality-constraints"><a href="#how-oil-prices-respond-to-reserve-quality-constraints">#</a>How Oil Prices Respond to Reserve Quality Constraints</h2><p>Supply tightness does not automatically translate into sustained high oil prices under normal conditions. Many variables intersect: OPEC&#43; production decisions, demand growth in emerging economies, the pace of the energy transition, currency effects, and geopolitical disruptions all influence where prices settle. The Strait of Hormuz closure in 2026 demonstrated this in real time. Brent crude spiked to $138 per barrel in April before falling back to an average of $107 per barrel in May. The EIA&#039;s June 2026 STEO forecasts Brent at around $105 per barrel through June and July, declining toward $79 per barrel in 2027 as shut-in production gradually recovers and supply flows normalise<sup>6</sup>.</p><p>What the reserves quality issue does introduce is a structural floor under long-run oil prices. If the marginal barrel of supply becomes progressively more expensive to produce, the breakeven price required to incentivize new development rises over time. This has historically been a bullish signal for oil prices over multi-year cycles, even if short-term volatility can push prices well below those levels.</p><p>High oil prices carry risks too. They accelerate demand destruction by making alternatives more competitive, attract investment into energy transition technologies, and invite political intervention through strategic reserve releases or windfall taxes on producers. The relationship between supply scarcity and price is real, but it is not linear.</p><h2 id="ways-investors-get-exposure-to-oil-and-gas-reserves"><a href="#ways-investors-get-exposure-to-oil-and-gas-reserves">#</a>Ways Investors Get Exposure to Oil and Gas Reserves</h2><p>Investors have several routes into the oil and gas sector, each with a different risk and return profile.</p><h3 id="upstream-ep-stocks"><a href="#upstream-ep-stocks">#</a>Upstream E&amp;P stocks</h3><p>These offer the most direct exposure to the reserves quality issue. These companies find, develop, and produce oil and gas. Their value is closely tied to the quality and scale of their reserve base, making reserve replacement ratios and finding costs key metrics to watch. These stocks tend to have the highest operational leverage to oil prices.</p><h3 id="integrated-majors"><a href="#integrated-majors">#</a>Integrated majors</h3><p>These combine upstream production with downstream refining and marketing. They have more diversified earnings streams and tend to be more resilient through price cycles, though their upside in a supply-constrained environment is more muted than pure-play E&amp;P companies.</p><h3 id="midstream-stocks"><a href="#midstream-stocks">#</a>Midstream stocks</h3><p>Pipelines, storage, and processing infrastructure offer a different exposure altogether. Their revenues are often fee-based and less directly tied to commodity prices, making them attractive to investors seeking income rather than price upside. They tend to carry lower volatility than E&amp;P.</p><h3 id="oil-and-gas-etfs-and-funds"><a href="#oil-and-gas-etfs-and-funds">#</a>Oil and gas ETFs and funds</h3><p>These provide diversified sector exposure without the need to select individual operators. Some funds focus specifically on exploration and production, others on the full value chain or specific geographies.</p><p>Each vehicle carries its own cost structure, liquidity profile, and tax treatment. Understanding what drives returns in each category matters more than picking the category with the best recent performance.</p><h2 id="key-risks-to-watch"><a href="#key-risks-to-watch">#</a>Key Risks to Watch</h2><h3 id="energy-transition-pace"><a href="#energy-transition-pace">#</a>Energy transition pace</h3><p>If the shift to renewables accelerates faster than current projections suggest, demand for oil and gas could peak sooner than expected. That would erode the investment case for high-cost reserve development and compress valuations for producers holding assets that are uneconomic at lower price levels.</p><h3 id="regulatory-and-esg-constraints"><a href="#regulatory-and-esg-constraints">#</a>Regulatory and ESG constraints</h3><p>Access to capital for new oil and gas development has tightened as institutional investors apply emissions-based screening criteria. Companies that cannot demonstrate a credible pathway to lower carbon intensity may find their cost of capital rising even if commodity prices support their economics.</p><h3 id="geopolitical-disruption"><a href="#geopolitical-disruption">#</a>Geopolitical disruption</h3><p>A significant share of global oil and gas reserves sits in politically complex jurisdictions, and the consequences of disruption can be severe. The closure of the Strait of Hormuz in 2026 following US-Israel-Iran military conflict removed an estimated 12 to 13 million barrels per day from global supply, the largest single oil supply disruption in modern market history according to multiple analysts<sup>7</sup>. Brent prices spiked to $138 per barrel in April 2026. Supply disruptions of this scale, nationalization risk, and abrupt changes in export policy are recurring features of the sector and can rapidly reshape the investment landscape for oil and gas stocks.</p><h3 id="windfall-tax-risk"><a href="#windfall-tax-risk">#</a>Windfall tax risk</h3><p>Several governments have imposed temporary or permanent levies on upstream oil profits during periods of elevated prices. These can materially affect after-tax returns even when pre-tax economics are strong.</p><h3 id="operational-cost-inflation"><a href="#operational-cost-inflation">#</a>Operational cost inflation</h3><p>The services and equipment required for upstream oil and gas development, drilling rigs, subsea equipment, engineering labor, have experienced significant cost inflation in recent years. Higher input costs can turn nominally attractive assets into marginal ones.</p><h2 id="frequently-asked-questions"><a href="#frequently-asked-questions">#</a>Frequently Asked Questions</h2><h3 id="is-the-world-running-out-of-oil-and-gas"><a href="#is-the-world-running-out-of-oil-and-gas">#</a>Is the world running out of oil and gas?</h3><p>No. Total discovered and potentially discoverable oil and gas resources remain well in excess of projected global consumption through 2050 across most demand scenarios. The issue is not absolute scarcity but economic and environmental quality: a large portion of technically recoverable resources is too expensive or too carbon-intensive to develop under current conditions.</p><h3 id="what-is-the-difference-between-reserves-and-resources"><a href="#what-is-the-difference-between-reserves-and-resources">#</a>What is the difference between reserves and resources?</h3><p>Resources refers to the total volume of oil or gas that exists in a formation. Reserves are the subset that can be extracted commercially under current prices and technology. Proved reserves are the most certain category, and they are what drives a company&#039;s balance sheet value and production outlook.</p><h3 id="why-does-reserve-quality-matter-for-stock-valuation"><a href="#why-does-reserve-quality-matter-for-stock-valuation">#</a>Why does reserve quality matter for stock valuation?</h3><p>A company&#039;s reserves are its production pipeline. Low-cost reserves generate stronger margins and free cash flow. High-cost reserves may be profitable only at elevated commodity prices, making the company&#039;s earnings more volatile. Reserve replacement ratios, finding costs per barrel, and breakeven prices are among the metrics analysts use to compare reserve quality across companies.</p><h3 id="what-drives-oil-price-over-the-long-run"><a href="#what-drives-oil-price-over-the-long-run">#</a>What drives oil price over the long run?</h3><p>The long-run oil price tends to settle around the cost of the marginal barrel required to meet demand. As high-quality, low-cost reserves deplete, that marginal cost rises, supporting a higher price floor over time. In practice, OPEC&#43; supply management, geopolitical events, and demand shocks regularly drive prices well above or below that theoretical floor.</p><h2 id="explore-oil-and-gas-investing-further"><a href="#explore-oil-and-gas-investing-further">#</a>Explore Oil and Gas Investing Further</h2><p>The supply gap facing the upstream sector creates real opportunities for investors who know where to look. If this article has prompted you to dig deeper, a good starting point is understanding <a href="https://www.valuethemarkets.com/analysis/investing-ideas/investing-oil-gas-stocks" class="underline underline underline-offset-2 decoration-1 decoration-current/40 hover:decoration-current focus:decoration-current">oil and gas stocks</a> as an asset class and how different parts of the sector behave across the commodity cycle.</p><p><a href="https://www.valuethemarkets.com/analysis/investing-ideas/investing-oil-gas-exploration-production-eandp-stocks" class="underline underline underline-offset-2 decoration-1 decoration-current/40 hover:decoration-current focus:decoration-current">E&amp;P stocks</a> sit closest to the reserves quality issue covered here. Their valuations are directly tied to what they own in the ground and what it costs to get it out. <a href="https://www.valuethemarkets.com/analysis/investing-ideas/investing-oil-gas-midstream-stocks" class="underline underline underline-offset-2 decoration-1 decoration-current/40 hover:decoration-current focus:decoration-current">Midstream stocks</a> offer a different proposition: fee-based revenues and income-oriented returns that are less exposed to commodity price swings.</p><p>For investors building a broader energy and commodities allocation, it is also worth understanding <a href="https://www.valuethemarkets.com/analysis/back-to-basics-a-guide-to-the-different-types-of-wells-used-by-oil-gas-companies" class="underline underline underline-offset-2 decoration-1 decoration-current/40 hover:decoration-current focus:decoration-current">the different types of oil wells</a> and how field economics vary by geology and location. Our guides on <a href="https://www.valuethemarkets.com/analysis/investing-ideas/how-to-find-investment-opportunities" class="underline underline underline-offset-2 decoration-1 decoration-current/40 hover:decoration-current focus:decoration-current">how to find investment opportunities</a>, <a href="https://www.valuethemarkets.com/education/how-to-buy-otc-stocks" class="underline underline underline-offset-2 decoration-1 decoration-current/40 hover:decoration-current focus:decoration-current">how to buy OTC stocks</a>, and <a href="https://www.valuethemarkets.com/education/how-to-buy-tsx-stocks" class="underline underline underline-offset-2 decoration-1 decoration-current/40 hover:decoration-current focus:decoration-current">how to buy TSX stocks</a> cover the practical side of getting exposure. <a href="https://www.valuethemarkets.com/analysis/investing-ideas/why-invest-in-gold" class="underline underline underline-offset-2 decoration-1 decoration-current/40 hover:decoration-current focus:decoration-current">Investing in gold</a> is also worth considering as a complementary diversification option.</p>
                ]]>
            </content>
                                                <category term="Investing Ideas" />
            
            <published>2026-06-09T04:00:00+00:00</published>
            <updated>2026-06-10T11:08:33+00:00</updated>
        </entry>
            <entry>
            <title><![CDATA[Midstream Stocks: How Pipeline Investing Works]]></title>
            <link rel="alternate" href="https://www.valuethemarkets.com/analysis/investing-ideas/investing-oil-gas-midstream-stocks" />
            <id>https://www.valuethemarkets.com/34588</id>
            <author>
                <name><![CDATA[Kirsteen Mackay]]></name>
                        <email><![CDATA[kirsteen.mackay@digitonic.co.uk]]></email>
                    </author>
            <summary type="html">
                <![CDATA[A guide to midstream oil and gas stocks for retail investors: how fee-based revenues work, dividend yields, LNG growth, and risks to know in 2026.]]>
            </summary>
                        <content type="html">
                <![CDATA[
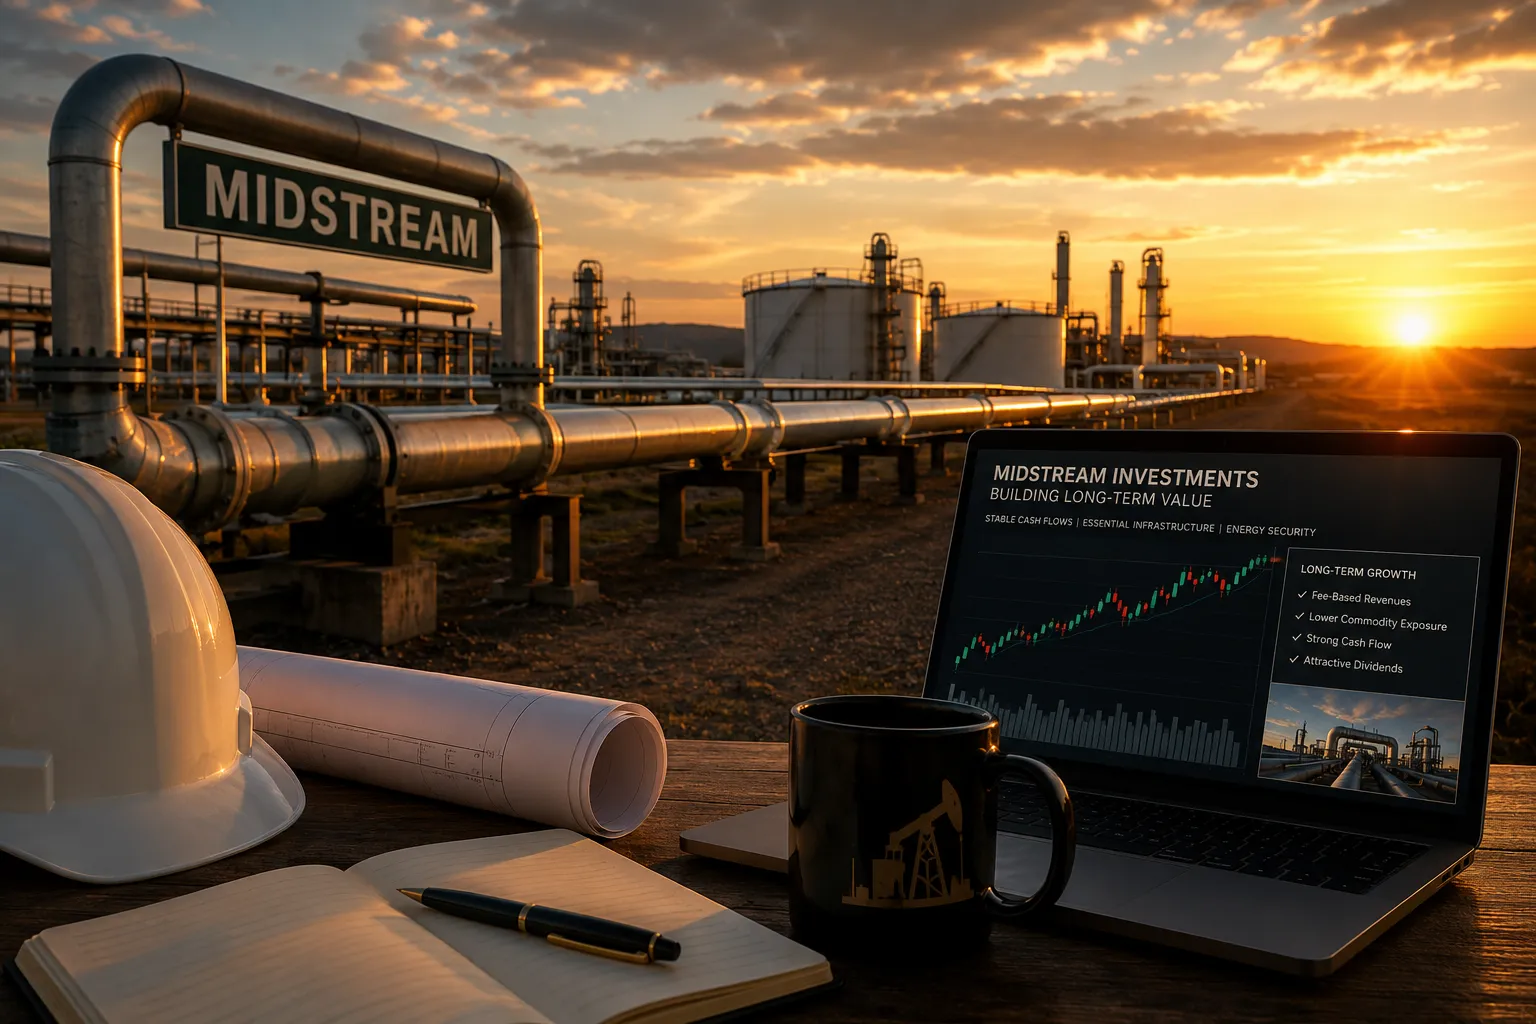
                                        <p><a href="https://www.valuethemarkets.com/analysis/investing-ideas/investing-oil-gas-midstream-stocks"><img alt="Midstream Stocks: How Pipeline Investing Works" src="https://www.valuethemarkets.com/curator/media/d2501c12-20c9-425c-ba38-d4830669e7e0.png?fm=webp&amp;q=80&amp;s=d9368348b225a4b1f808fd3745fc0287" /></a></p>
                                        <h2 id="investing-in-oil-and-gas-midstream-stocks"><a href="#investing-in-oil-and-gas-midstream-stocks">#</a>Investing in Oil and Gas Midstream Stocks</h2><p>Midstream stocks have become one of the most discussed corners of the energy sector in 2026, and for good reason. Pipeline and infrastructure operators sit at the intersection of two structural demand shifts: surging US liquefied natural gas (LNG) exports and the rapid buildout of AI data centers requiring firm natural gas-fired power. For investors seeking high dividend income with lower commodity price exposure than traditional oil and gas stocks, the midstream sector offers a distinctive combination.</p><p>This guide explains how midstream companies work, why investors use them, how to get exposure, and what risks to watch.</p><h2 id="what-is-the-midstream-sector"><a href="#what-is-the-midstream-sector">#</a>What is the Midstream Sector?</h2><p>The midstream sector connects oil and gas producers with end markets. Midstream companies operate the pipelines, processing plants, storage facilities, and export terminals that move crude oil, natural gas, and natural gas liquids (NGLs) from the wellhead to refineries, power plants, industrial users, and LNG export terminals on the Gulf Coast.</p><p>The sector sits between upstream (exploration and production) and downstream (refining and retail). That middle position matters for investors because most midstream operators earn fee-based revenue tied to the volume of energy moving through their infrastructure, not the price of that energy. Revenues are largely insulated from oil and gas price swings, with many contracts incorporating inflation-linked tariff escalators. That structure is why midstream cash flows tend to be steadier than those in other parts of the energy industry.</p><p>Many midstream companies are structured as master limited partnerships (MLPs), a corporate form that passes most of its cash flow to unitholders as quarterly distributions. MLPs are structured to pass most of their cash flow to unitholders as quarterly distributions, and typically yield 5% to 8% annually, making them natural income vehicles. Other midstream operators are organized as standard C-corporations, which trade with greater flexibility and exposure to growth themes like natural gas demand.</p><h2 id="why-investors-choose-midstream-stocks"><a href="#why-investors-choose-midstream-stocks">#</a>Why Investors Choose Midstream Stocks</h2><h3 id="income"><a href="#income">#</a>Income</h3><p>The Alerian Midstream Energy Index offered a dividend yield of approximately 5% as of November 30, 2025, with forecasted dividend growth of 5% to 7% for 2026, according to Tortoise Capital&#039;s 2026 Energy Outlook<sup>1</sup>. Enterprise Products Partners, one of the largest midstream MLPs, has raised its distribution for 27 consecutive years, every year since its 1998 IPO, according to company investor materials<sup>2</sup>.</p><h3 id="lower-commodity-price-sensitivity"><a href="#lower-commodity-price-sensitivity">#</a>Lower Commodity Price Sensitivity</h3><p>Because revenues are driven by throughput volumes rather than commodity prices, midstream has consistently held its ground during periods of oil price volatility. In 2025, the Alerian MLP ETF (AMLP) returned 5.8% even as oil prices declined by double digits, according to Yahoo Finance performance data<sup>3</sup>. In 2026, with oil markets roiled by the near-closure of the Strait of Hormuz, AMLP gained 13.8% on a total-return basis through the end of March, again outpacing broader energy equities, according to the ALPS Funds fact sheet<sup>4</sup>.</p><h3 id="structural-demand-growth"><a href="#structural-demand-growth">#</a>Structural Demand Growth</h3><p>Two trends are creating durable volume growth for natural gas pipelines. First, US LNG exports are forecast to average 17.0 Bcf/d in 2026, up from 15.1 Bcf/d in 2025, according to the EIA&#039;s April 2026 Short-Term Energy Outlook<sup>5</sup>. Exports ran at nearly 17.9 Bcf/d in March 2026, the second-highest monthly volume on record<sup>6</sup>. Geopolitical disruptions to LNG supply through the Strait of Hormuz have widened the spread between US and international gas prices, further incentivising US export volumes. Second, AI data centers are driving electricity demand that natural gas is increasingly being called on to meet. The IEA has projected that natural gas will supply roughly 130 terawatt-hours of the nearly 250 terawatt-hours of new electricity generation needed for US data centers by 2030, according to ING Think&#039;s November 2025 analysis<sup>7</sup>. Meeting that demand requires more pipeline infrastructure. The EIA forecasts US LNG exports will rise further to 18.6 Bcf/d in 2027 as five new export projects ramp up, requiring substantial new pipeline capacity to move gas from producing regions to Gulf Coast terminals, according to the April 2026 Short-Term Energy Outlook.</p><h3 id="improving-financial-discipline"><a href="#improving-financial-discipline">#</a>Improving Financial Discipline</h3><p>The sector has shifted away from the debt-heavy expansion strategies common before 2020. Companies now emphasize contract-backed growth funded within free cash flow, according to NXG Cushing Midstream Energy Fund&#039;s 2025 annual report<sup>8</sup>. Balance sheets are stronger, leverage is lower, and capital allocation is more shareholder-focused through rising dividends and opportunistic buybacks.</p><h2 id="how-to-get-exposure"><a href="#how-to-get-exposure">#</a>How to Get Exposure</h2><h3 id="individual-stocks"><a href="#individual-stocks">#</a>Individual Stocks</h3><p>The largest midstream companies investors consider include names such as Enterprise Products Partners (EPD), Enbridge (ENB), Energy Transfer (ET), Kinder Morgan (KMI), Williams Companies (WMB), ONEOK (OKE), and MPLX. Each has a distinct asset mix; some are more weighted to natural gas pipelines while others have greater crude oil and NGL exposure. Energy Transfer, for example, has been leaning into AI data center infrastructure investment, while Enbridge has substantial Canadian crude oil pipeline exposure.</p><p>For LNG-focused midstream exposure, Cheniere Energy Partners (CQP) remains the largest pure-play exporter. New projects from NextDecade&#039;s Rio Grande LNG facility are progressing, adding further capacity in the years ahead.</p><h3 id="etfs"><a href="#etfs">#</a>ETFs</h3><p>The Alerian Midstream Energy ETF (AMLP) and similar funds offer diversified exposure across both MLPs and C-corporations in the North American energy infrastructure space. ETFs remove single-company concentration risk and simplify the tax treatment that can complicate direct MLP ownership for some investors.</p><p>When comparing individual stocks to ETFs, consider that ETF structures typically smooth out some of the yield available from individual MLPs but also reduce the tax complexity. The Alerian Midstream Energy Dividend UCITS ETF (BIT: MMLP) tracks a dividend-weighted index and is available to European investors.</p><h2 id="risks-and-factors-to-watch"><a href="#risks-and-factors-to-watch">#</a>Risks and Factors to Watch</h2><h3 id="volume-sensitivity"><a href="#volume-sensitivity">#</a>Volume Sensitivity</h3><p>Fee-based revenues still depend on volumes moving through the pipes. A sustained drop in oil and gas production, whether from a commodity price collapse, a policy shift, or accelerated renewable substitution, would reduce throughput and pressure earnings.</p><h3 id="project-and-permitting-risk"><a href="#project-and-permitting-risk">#</a>Project and Permitting Risk</h3><p>New infrastructure requires regulatory approvals that can be delayed or blocked. Deloitte estimates that more than $35 billion needs to be invested through 2027 in natural gas infrastructure alone, representing around 7,500 miles of new pipeline capacity<sup>9</sup>. Permitting, supply chain constraints, and labor availability are all variables that could delay or increase the cost of those projects..</p><h3 id="interest-rate-sensitivity"><a href="#interest-rate-sensitivity">#</a>Interest Rate Sensitivity</h3><p>High-dividend sectors tend to reprice when bond yields rise. Midstream has shown more resilience than some other income sectors, partly because its cash flows are more predictable, but rate sensitivity remains a factor investors should monitor.</p><h3 id="mlp-tax-complexity"><a href="#mlp-tax-complexity">#</a>MLP Tax Complexity</h3><p>MLPs issue K-1 tax forms rather than standard 1099-DIVs, which complicates filing for some investors. Tax-deferred accounts like IRAs can trigger unrelated business taxable income (UBTI) rules when holding MLPs. Investors should verify the tax implications with an advisor before committing to MLP-structured investments.</p><h3 id="commodity-price-sentiment"><a href="#commodity-price-sentiment">#</a>Commodity Price Sentiment</h3><p>Even though revenues are fee-based, midstream stocks tend to move with broader energy sentiment when oil prices fall sharply. The sector is not completely insulated from commodity price perception, as noted in Alerian&#039;s 2025 Midstream/MLP Outlook.</p><h3 id="energy-transition"><a href="#energy-transition">#</a>Energy Transition</h3><p>A faster-than-expected shift away from fossil fuels would reduce long-term volumes. Williams Companies and Kinder Morgan have both increased exposure to alternative energy and lower-carbon initiatives to partly offset this risk, but the long-term transition remains the sector&#039;s most significant structural headwind.</p><h2 id="faq"><a href="#faq">#</a>FAQ</h2><h3 id="what-is-the-difference-between-an-mlp-and-a-c-corporation-in-the-midstream-sector"><a href="#what-is-the-difference-between-an-mlp-and-a-c-corporation-in-the-midstream-sector">#</a>What is the difference between an MLP and a C-corporation in the midstream sector?</h3><p>An MLP (master limited partnership) must distribute most of its cash flow to unitholders, which produces high yields but limits retained capital for growth. A C-corporation retains more flexibility to reinvest earnings and buy back shares. C-corporations tend to have more exposure to natural gas growth themes; MLPs typically offer higher current yield. Many investors hold both types for different reasons.</p><h3 id="are-midstream-dividends-reliable"><a href="#are-midstream-dividends-reliable">#</a>Are midstream dividends reliable?</h3><p>Midstream dividends have historically been among the most consistent in the energy sector because they are supported by long-term, fee-based contracts rather than commodity prices. Enterprise Products Partners has raised its distribution for 27 consecutive years. That said, dividends can be cut if volumes fall sharply or leverage becomes unsustainable, as happened to some midstream companies during 2020. Checking dividend coverage ratios (distributions covered by distributable cash flow) is an important step before investing.</p><h3 id="does-midstream-benefit-from-higher-oil-prices"><a href="#does-midstream-benefit-from-higher-oil-prices">#</a>Does midstream benefit from higher oil prices?</h3><p>Not directly. Higher oil prices typically encourage more production, which increases pipeline volumes and throughput revenues, but the fee-based structure means midstream operators do not earn more per barrel when prices rise. The link is indirect: production activity drives volumes, and volumes drive revenue.</p><h3 id="what-financial-metrics-matter-most-for-midstream-stocks"><a href="#what-financial-metrics-matter-most-for-midstream-stocks">#</a>What financial metrics matter most for midstream stocks?</h3><p>Distributable cash flow and the distributable cash flow coverage ratio are the most midstream-specific metrics to watch. They show whether a company is generating enough cash to cover its dividend and invest in growth. Beyond that, debt-to-EBITDA leverage ratios, capital expenditure guidance, and contract duration all matter. A lower leverage ratio and long-duration contracts generally indicate a more stable investment.</p><h3 id="can-midstream-stocks-fall-in-a-recession"><a href="#can-midstream-stocks-fall-in-a-recession">#</a>Can midstream stocks fall in a recession?</h3><p>Yes. A recession that reduced industrial activity and energy consumption would lower throughput volumes and could compress revenue. However, midstream has shown more stability than upstream energy names during previous downturns because consumers and industries continue to use gas and refined products even when growth slows. The 2025 experience, where the sector delivered positive returns despite macro headwinds, is a useful recent reference point.</p><h2 id="keep-exploring-the-energy-sector"><a href="#keep-exploring-the-energy-sector">#</a>Keep Exploring the Energy Sector</h2><p>Midstream is one piece of a broader energy investing picture. Investors who want to go deeper can look at <a href="https://www.valuethemarkets.com/analysis/investing-ideas/investing-oil-gas-stocks" class="underline underline underline-offset-2 decoration-1 decoration-current/40 hover:decoration-current focus:decoration-current">oil and gas stocks</a> more broadly, or narrow their focus to <a href="https://www.valuethemarkets.com/analysis/investing-ideas/investing-oil-gas-exploration-production-eandp-stocks" class="underline underline underline-offset-2 decoration-1 decoration-current/40 hover:decoration-current focus:decoration-current">exploration and production (E&amp;P) stocks</a>, where the <a href="https://www.valuethemarkets.com/analysis/investing-ideas/challenge-finding-high-quality-oil-gas-reserves" class="underline underline underline-offset-2 decoration-1 decoration-current/40 hover:decoration-current focus:decoration-current">challenge of finding high-quality reserves</a> creates both risk and opportunity. For portfolio diversification beyond energy, see our guides on <a href="https://www.valuethemarkets.com/analysis/investing-ideas/how-to-find-investment-opportunities" class="underline underline underline-offset-2 decoration-1 decoration-current/40 hover:decoration-current focus:decoration-current">finding investment opportunities</a>, <a href="https://www.valuethemarkets.com/analysis/investing-ideas/why-invest-in-gold" class="underline underline underline-offset-2 decoration-1 decoration-current/40 hover:decoration-current focus:decoration-current">investing in gold</a>, and how to buy <a href="https://www.valuethemarkets.com/education/how-to-buy-otc-stocks" class="underline underline underline-offset-2 decoration-1 decoration-current/40 hover:decoration-current focus:decoration-current">OTC</a> and <a href="https://www.valuethemarkets.com/education/how-to-buy-tsx-stocks" class="underline underline underline-offset-2 decoration-1 decoration-current/40 hover:decoration-current focus:decoration-current">TSX stocks</a>.<br /></p>
                ]]>
            </content>
                                                <category term="Investing Ideas" />
            
            <published>2026-06-09T07:00:00+00:00</published>
            <updated>2026-06-10T10:00:51+00:00</updated>
        </entry>
            <entry>
            <title><![CDATA[Investing In Oil and Gas Exploration and Production (E&amp;P) Stocks]]></title>
            <link rel="alternate" href="https://www.valuethemarkets.com/analysis/investing-ideas/investing-oil-gas-exploration-production-eandp-stocks" />
            <id>https://www.valuethemarkets.com/34579</id>
            <author>
                <name><![CDATA[Kirsteen Mackay]]></name>
                        <email><![CDATA[kirsteen.mackay@digitonic.co.uk]]></email>
                    </author>
            <summary type="html">
                <![CDATA[Explore how oil and gas E&P stocks work, what metrics to use when evaluating them, and the risks every investor should understand before buying.]]>
            </summary>
                        <content type="html">
                <![CDATA[
                                        <p><a href="https://www.valuethemarkets.com/analysis/investing-ideas/investing-oil-gas-exploration-production-eandp-stocks"><img alt="Investing In Oil and Gas Exploration and Production (E&amp;P) Stocks" src="https://www.valuethemarkets.com/curator/media/505aeb67-a7ea-4e1d-9f51-49aa3414b0f4.png?fm=webp&amp;q=80&amp;s=1f76aa6f9e822407cb58af43b4f7fd3f" /></a></p>
                                        <p>Oil and gas exploration and production (E&amp;P) stocks give investors direct exposure to the upstream end of the energy supply chain: the companies that find, drill, and extract oil and gas from the ground. The E&amp;P sector has changed considerably since 2020. Companies that once prioritized production growth at any cost have shifted toward capital discipline, debt reduction, and shareholder returns. For investors willing to navigate commodity price risk, that shift has made E&amp;P stocks a more defensible income and growth opportunity than they were in prior cycles.</p><p>This guide explains how E&amp;P companies operate, what drives their financial performance, and how investors can evaluate them.</p><h2 id="what-ep-companies-do"><a href="#what-ep-companies-do">#</a>What E&amp;P Companies Do</h2><p>E&amp;P companies sit at the upstream end of the oil and gas value chain. Their job is to locate potential reserves, acquire the rights to drill them, complete wells, and bring oil and gas to the surface for sale. Everything downstream from that point (refining, marketing, retail fuel) is handled by other segments of the industry.</p><p>There are three broad categories of E&amp;P company investors will encounter.</p><h3 id="integrated-majors"><a href="#integrated-majors">#</a>Integrated Majors</h3><p>Large integrated companies such as ExxonMobil (NYSE: XOM), Shell (NYSE: SHEL), Chevron (NYSE: CVX), and BP (NYSE: BP) are involved across the entire value chain, from exploration through to refined product sales. Their E&amp;P divisions are large but represent only part of the total business. The integrated structure provides some natural hedge against oil price swings: when crude prices fall and upstream margins compress, refining margins often improve.</p><h3 id="independent-ep-companies"><a href="#independent-ep-companies">#</a>Independent E&amp;P Companies</h3><p>Independents focus exclusively on the upstream segment. They tend to have higher leverage to crude oil and natural gas prices than the majors, which makes them more volatile but also more sensitive to price upside. Devon Energy (NYSE: DVN), Occidental Petroleum (NYSE: OXY), and EOG Resources (NYSE: EOG) are well-known US independents operating across major shale basins.</p><h3 id="exploration-focused-companies"><a href="#exploration-focused-companies">#</a>Exploration-Focused Companies</h3><p>Smaller companies focused primarily on finding new reserves rather than producing from existing ones carry the highest risk and highest potential reward in the sector. Examples include Kosmos Energy (NASDAQ: KOS), which focuses on deepwater exploration in Africa and the Gulf of Mexico. These companies typically have limited production revenue and depend on capital markets to fund drilling programs.</p><h2 id="why-investors-consider-ep-stocks"><a href="#why-investors-consider-ep-stocks">#</a>Why Investors Consider E&amp;P Stocks</h2><h3 id="dividend-growth-and-shareholder-returns"><a href="#dividend-growth-and-shareholder-returns">#</a>Dividend Growth and Shareholder Returns</h3><p>One of the most significant changes in the E&amp;P sector since 2020 is the emphasis on returning cash to shareholders. Following a period of severe financial stress in 2019 and 2020, when the S&amp;P E&amp;P index fell roughly 90% from its 2014 peak, producers restructured their balance sheets and reoriented their capital allocation frameworks. The average E&amp;P dividend yield across the sector more than tripled between 2021 and 2023, according to RBN Energy&#039;s analysis of 39 large US producers, with several adding special dividends that brought total yields close to or above 10%<sup>5</sup>. While yields have moderated since then as oil prices declined from their 2022 highs, the sector has largely sustained dividend payouts at levels well above its historical norm.</p><p>EOG Resources offers a concrete example. In 2025, EOG generated $4.7 billion in free cash flow and returned 100% of it to shareholders through regular dividends and share repurchases, according to the company&#039;s 2025 annual report. EOG has not cut or suspended its dividend in 28 years.</p><h3 id="us-production-at-record-levels"><a href="#us-production-at-record-levels">#</a>US Production at Record Levels</h3><p>US crude oil production reached a new annual record of 13.6 million barrels per day in 2025, a 3% increase from 2024, according to the US Energy Information Administration (EIA)<sup>4</sup>. The Permian Basin in western Texas and southeastern New Mexico alone accounted for 48% of total US output, producing 6.6 million barrels per day. Critically, this record was achieved with 5% fewer active rigs than in 2024, reflecting meaningful gains in drilling efficiency. That efficiency profile matters to investors because it means producers can sustain or grow output at lower capital intensity.</p><h3 id="commodity-price-leverage"><a href="#commodity-price-leverage">#</a>Commodity Price Leverage</h3><p>E&amp;P stocks offer concentrated exposure to crude oil and natural gas prices. When prices rise, revenues and free cash flow can increase sharply without a proportional increase in operating costs. This leverage is a feature for investors who want energy exposure in their portfolio, though it is also the source of the sector&#039;s characteristic volatility.</p><h2 id="how-global-demand-trends-affect-ep-stocks"><a href="#how-global-demand-trends-affect-ep-stocks">#</a>How Global Demand Trends Affect E&amp;P Stocks</h2><p>The global demand backdrop for oil has shifted. Oil demand increased by 0.65 million barrels per day in 2025, according to the IEA&#039;s Global Energy Review 2026<sup>1</sup>, a pace well below the pre-pandemic trend. Transport fuel consumption has flattened as EV adoption accelerates, with jet fuel now the only meaningful growth segment within transport. The IEA&#039;s May 2026 Oil Market Report projects global demand will contract by 420,000 barrels per day in 2026 to 104 million barrels per day, as the US-Israel-Iran conflict and closure of the Strait of Hormuz have disrupted supply chains and dampened consumption<sup>2</sup>.</p><p>The IEA projects global oil demand will plateau around 105.5 million barrels per day by 2030, with petrochemical feedstocks taking over from transport as the primary source of growth, according to the IEA&#039;s Oil 2025 report<sup>3</sup>. This demand ceiling does not eliminate the investment case for E&amp;P stocks, but it does shape how investors should think about the long-term trajectory. Companies with low production costs, efficient capital structures, and genuine free cash flow generation are better positioned in a plateau environment than those dependent on perpetual price increases.</p><p>Supply dynamics through 2025 are also relevant. Global oil supply exceeded demand through much of 2025, with OPEC&#43; gradually unwinding production cuts. That surplus has kept oil prices under pressure: WTI averaged approximately $65 per barrel in 2025, down from $77 in 2024, according to EIA data.</p><h2 id="key-metrics-for-evaluating-ep-companies"><a href="#key-metrics-for-evaluating-ep-companies">#</a>Key Metrics for Evaluating E&amp;P Companies</h2><p>Understanding the following metrics helps investors distinguish between stronger and weaker operators.</p><h3 id="free-cash-flow"><a href="#free-cash-flow">#</a>Free Cash Flow</h3><p>Free cash flow (FCF) is revenue minus operating costs and capital expenditure. For E&amp;P companies, consistent FCF generation across commodity price cycles is the most important indicator of financial health. It funds dividends, debt repayment, and share buybacks without requiring external financing.</p><h3 id="production-costs-and-breakeven"><a href="#production-costs-and-breakeven">#</a>Production Costs and Breakeven</h3><p>The cost to produce a barrel of oil equivalent (BOE) varies significantly between companies and basins. Lower breakeven prices mean a company remains profitable at a wider range of commodity prices. Some high-quality Permian operators reportedly have breakevens below $40 per barrel, providing a meaningful buffer against price declines.</p><h3 id="debt-to-capital-ratio"><a href="#debt-to-capital-ratio">#</a>Debt-to-Capital Ratio</h3><p>The E&amp;P sector&#039;s debt-to-capital ratio peaked at around 40% in 2020, according to RBN Energy&#039;s analysis of 39 major producers. Disciplined free cash flow allocation drove that ratio substantially lower through 2021 and 2022. Investors should monitor whether recent acquisition activity has pushed leverage back up, and whether management has a credible plan to reduce it.</p><h3 id="reserve-life-and-replacement"><a href="#reserve-life-and-replacement">#</a>Reserve Life and Replacement</h3><p>How many years of production a company can sustain from its existing proved reserves (reserve life index) and whether it is replacing the reserves it produces (reserve replacement ratio) indicate whether a company is growing or shrinking its underlying asset base.</p><h3 id="dividend-yield-and-payout-sustainability"><a href="#dividend-yield-and-payout-sustainability">#</a>Dividend Yield and Payout Sustainability</h3><p>Given the sector&#039;s renewed emphasis on income, dividend yield deserves attention. The more important question is sustainability: what oil price does the company require to cover both its maintenance capital and its dividend? Companies that disclose a specific price-based dividend coverage threshold are providing more transparent guidance than those that do not.</p><h2 id="risks-of-investing-in-ep-stocks"><a href="#risks-of-investing-in-ep-stocks">#</a>Risks of Investing in E&amp;P Stocks</h2><h3 id="oil-price-volatility"><a href="#oil-price-volatility">#</a>Oil Price Volatility</h3><p>E&amp;P revenue is directly tied to commodity prices, which can move sharply and unexpectedly. Supply decisions by OPEC&#43;, changes in global trade policy, and macroeconomic slowdowns have all produced significant price swings in recent years. At $65 per barrel as seen through much of 2025, many US producers remain profitable; at $40 per barrel, free cash flow would be severely compressed for many operators.</p><h3 id="geopolitical-supply-risk"><a href="#geopolitical-supply-risk">#</a>Geopolitical Supply Risk</h3><p>The supply picture has shifted sharply in 2026. The closure of the Strait of Hormuz following the US-Israel-Iran conflict has resulted in cumulative supply losses of an estimated 12.8 million barrels per day through April 2026, according to the IEA&#039;s May 2026 Oil Market Report. While higher output from the Americas is providing some offset, price volatility driven by geopolitical disruption now represents the more immediate risk to E&amp;P valuations than oversupply.</p><h3 id="regulatory-and-environmental-risk"><a href="#regulatory-and-environmental-risk">#</a>Regulatory and Environmental Risk</h3><p>Environmental permitting, methane emissions regulations, leasing restrictions on federal land, and carbon-related policy all affect E&amp;P operations and costs. These risks vary by geography: US-listed producers face a different regulatory environment than those operating in frontier markets.</p><h3 id="capital-intensity"><a href="#capital-intensity">#</a>Capital Intensity</h3><p>Exploration and production requires continuous capital investment to offset natural field decline. A company that cannot fund its drilling program from operating cash flow becomes dependent on debt or equity markets, which creates vulnerability during downturns.</p><h3 id="political-and-operational-risk"><a href="#political-and-operational-risk">#</a>Political and Operational Risk</h3><p>E&amp;P companies operating outside the US face political risk that can include contract renegotiation, export restrictions, sanctions, and conflict. This risk is most acute for exploration-focused companies operating in emerging markets.</p><h2 id="how-to-get-exposure-to-ep-stocks"><a href="#how-to-get-exposure-to-ep-stocks">#</a>How to Get Exposure to E&amp;P Stocks</h2><p>Investors have several practical options.</p><h3 id="individual-stocks"><a href="#individual-stocks">#</a>Individual Stocks</h3><p>Buying shares in individual E&amp;P companies offers the highest potential returns and the highest stock-specific risk. Research should focus on the metrics above, with particular attention to free cash flow yield, breakeven costs, and management&#039;s capital allocation track record.</p><h3 id="sector-etfs"><a href="#sector-etfs">#</a>Sector ETFs</h3><p>Exchange-traded funds provide diversified exposure across multiple E&amp;P companies in a single trade. The SPDR S&amp;P Oil and Gas Exploration and Production ETF (NYSE Arca: XOP) is one of the most widely used vehicles in this space, with approximately $1.8 billion in assets under management and an expense ratio of 0.35%. XOP uses an equal-weighted methodology, which gives smaller companies a larger share of the portfolio than they would receive in a market-cap-weighted fund. This amplifies upside in smaller operators but also increases concentration risk compared to a market-cap-weighted approach.</p><h3 id="integrated-majors-as-lower-volatility-entry-points"><a href="#integrated-majors-as-lower-volatility-entry-points">#</a>Integrated Majors as Lower-Volatility Entry Points</h3><p>Investors who want energy sector exposure but prefer lower commodity price sensitivity can gain some E&amp;P exposure through the integrated majors. Their refining and marketing divisions provide partial offsets when upstream margins fall.</p><h2 id="frequently-asked-questions"><a href="#frequently-asked-questions">#</a>Frequently Asked Questions</h2><h3 id="what-is-the-difference-between-an-ep-company-and-an-integrated-oil-company"><a href="#what-is-the-difference-between-an-ep-company-and-an-integrated-oil-company">#</a>What is the difference between an E&amp;P company and an integrated oil company?</h3><p>An E&amp;P company focuses solely on finding and extracting oil and gas from the ground. An integrated oil company does that and also refines crude oil into fuels, and in some cases markets and distributes those products to end consumers. Integrateds are generally less volatile because their downstream operations provide some hedge against crude price movements.</p><h3 id="what-oil-price-do-ep-companies-need-to-be-profitable"><a href="#what-oil-price-do-ep-companies-need-to-be-profitable">#</a>What oil price do E&amp;P companies need to be profitable?</h3><p>It varies considerably. High-quality US shale operators in the Permian Basin can generate free cash flow at WTI prices below $45 per barrel. Less efficient operators, particularly those in higher-cost offshore or frontier environments, may require $60 to $70 per barrel or more to sustain dividends and capital programs. Breakeven disclosures, where companies provide them, are worth checking before investing.</p><h3 id="are-ep-stocks-suitable-for-income-investors"><a href="#are-ep-stocks-suitable-for-income-investors">#</a>Are E&amp;P stocks suitable for income investors?</h3><p>E&amp;P stocks can generate meaningful income, but dividend sustainability depends on oil prices. The sector&#039;s shift toward base dividends set at conservative breakeven prices, with special dividends added when prices are strong, is a more investor-friendly structure than the pre-2020 model of maintaining fixed dividends regardless of cash flow. Investors focused on income should verify dividend coverage at a range of commodity price scenarios.</p><h3 id="how-do-geopolitical-events-affect-ep-stocks"><a href="#how-do-geopolitical-events-affect-ep-stocks">#</a>How do geopolitical events affect E&amp;P stocks?</h3><p>Geopolitical disruptions in major oil-producing regions can tighten global supply and push prices higher, which benefits E&amp;P revenues. However, companies operating in politically unstable regions face direct risk to their own assets and operations. US-listed E&amp;P companies focused on domestic shale production are more insulated from geopolitical supply risk than those with large international portfolios.</p><h2 id="take-your-research-further"><a href="#take-your-research-further">#</a>Take Your Research Further</h2><p>Understanding E&amp;P stocks is one piece of the energy investing puzzle. To build out your knowledge, read our guides on <a href="https://www.valuethemarkets.com/analysis/investing-ideas/investing-oil-gas-midstream-stocks" class="underline underline underline-offset-2 decoration-1 decoration-current/40 hover:decoration-current focus:decoration-current">oil and gas midstream stocks</a>, <a href="https://www.valuethemarkets.com/analysis/investing-ideas/challenge-finding-high-quality-oil-gas-reserves" class="underline underline underline-offset-2 decoration-1 decoration-current/40 hover:decoration-current focus:decoration-current">oil and gas reserves</a>, and the <a href="https://www.valuethemarkets.com/analysis/back-to-basics-a-guide-to-the-different-types-of-wells-used-by-oil-gas-companies" class="underline underline underline-offset-2 decoration-1 decoration-current/40 hover:decoration-current focus:decoration-current">different types of oil wells</a>. If you&#039;re ready to act, our step-by-step guides on <a href="https://www.valuethemarkets.com/analysis/market-reports-guides/guides/investing-oil-gas-stocks" target="_blank">investing in oil and gas stocks</a>, <a href="https://www.valuethemarkets.com/education/how-to-buy-otc-stocks" class="underline underline underline-offset-2 decoration-1 decoration-current/40 hover:decoration-current focus:decoration-current">how to buy OTC stocks</a>, <a href="https://www.valuethemarkets.com/education/how-to-buy-tsx-stocks" class="underline underline underline-offset-2 decoration-1 decoration-current/40 hover:decoration-current focus:decoration-current">how to buy TSX stocks</a>, and <a href="https://www.valuethemarkets.com/analysis/investing-ideas/how-to-find-investment-opportunities" class="underline underline underline-offset-2 decoration-1 decoration-current/40 hover:decoration-current focus:decoration-current">how to find investment opportunities</a> walk you through the process. For investors weighing energy against other commodities, see <a href="https://www.valuethemarkets.com/analysis/investing-ideas/why-invest-in-gold" class="underline underline underline-offset-2 decoration-1 decoration-current/40 hover:decoration-current focus:decoration-current">why investors buy gold</a>.</p>
                ]]>
            </content>
                                                <category term="Investing Ideas" />
            
            <published>2026-06-10T02:00:00+00:00</published>
            <updated>2026-06-10T08:15:24+00:00</updated>
        </entry>
            <entry>
            <title><![CDATA[Why Invest in Gold]]></title>
            <link rel="alternate" href="https://www.valuethemarkets.com/analysis/investing-ideas/why-invest-in-gold" />
            <id>https://www.valuethemarkets.com/32222</id>
            <author>
                <name><![CDATA[Kirsteen Mackay]]></name>
                        <email><![CDATA[kirsteen.mackay@digitonic.co.uk]]></email>
                    </author>
            <summary type="html">
                <![CDATA[Gold has delivered its strongest multi-year run in decades. Learn how it works as a hedge, diversifier, and safe haven for retail investors.]]>
            </summary>
                        <content type="html">
                <![CDATA[
                                        <p><a href="https://www.valuethemarkets.com/analysis/investing-ideas/why-invest-in-gold"><img alt="Why Invest in Gold" src="https://www.valuethemarkets.com/curator/media/84cf7067-fac1-4645-99de-acf799cfb648.png?fm=webp&amp;q=80&amp;s=7b2e75e54501389035ef2f339a83c443" /></a></p>
                                        <p><strong>Gold surpassed $5,000 per troy ounce during 2025</strong><sup>1</sup><strong> and has risen more than 40% over the past year. Here is what investors need to know before adding the metal to their portfolios.</strong></p><p>Investing in gold has attracted attention from retail and institutional investors alike, especially as inflation, geopolitical risk, and currency volatility have tested traditional portfolios. Gold is not a growth asset in the conventional sense. It pays no dividend and generates no earnings. But it has held purchasing power across centuries, and its low correlation with equities makes it a practical diversifier when markets turn volatile.</p><p>According to the World Gold Council, gold has generated positive returns during the vast majority of major market crises since 2000, including the 2008 global financial crisis, the 2020 COVID pullback, the 2022 inflation shock, and the April 2025 tariff selloff<sup>2</sup>. Total gold demand exceeded 5,000 tonnes for the first time in 2025, generating an unprecedented combined value of $555 billion. Understanding why that demand holds, and whether gold belongs in your portfolio, is the right starting point.</p><h2 id="what-gold-is-and-how-it-functions-as-an-investment"><a href="#what-gold-is-and-how-it-functions-as-an-investment">#</a>What Gold Is and How It Functions as an Investment</h2><p>Gold is a finite physical commodity with no counterparty risk. Unlike a stock or bond, it does not depend on a company&#039;s performance or a government&#039;s creditworthiness. Its value comes from scarcity, durability, and near-universal acceptance as a store of wealth.</p><p>In portfolio terms, gold typically behaves differently from equities. When equity markets fall sharply, investors often move capital into gold, which tends to push the gold price up. This negative or near-zero correlation is the core reason portfolio managers use gold as a hedge (a position designed to offset losses elsewhere). It does not guarantee gains during every downturn, but history suggests it reduces overall portfolio volatility.</p><p>Gold set 53 new all-time highs during 2025 alone, according to the World Gold Council<sup>1</sup>. The price crossed $3,000 when US tariffs were announced in April 2025, hit $4,000 during a prolonged US government shutdown, and surpassed $5,000 during the year&#039;s peak. It is currently trading around $4,500 per ounce as of May 2026, up over 40% year-on-year<sup>3</sup>.</p><h2 id="key-benefits-of-investing-in-gold"><a href="#key-benefits-of-investing-in-gold">#</a>Key Benefits of Investing in Gold</h2><p>The case for gold rests on four properties that are difficult to replicate with other asset classes.</p><h3 id="inflation-hedge"><a href="#inflation-hedge">#</a><strong>Inflation hedge</strong></h3><p>Gold tends to preserve purchasing power over long periods. When inflation erodes the real value of cash and fixed-income assets, gold has historically maintained or increased its nominal price. The World Gold Council&#039;s data shows that gold&#039;s average annual return since 1971 (when the US dollar was decoupled from gold) has outpaced CPI inflation over most multi-decade windows. Between 2016 and the end of 2025, gold&#039;s price rose from $1,250 to $4,318 per ounce, according to National Mining Association data<sup>4</sup>.</p><h3 id="portfolio-diversification"><a href="#portfolio-diversification">#</a><strong>Portfolio diversification</strong></h3><p>Gold&#039;s correlation with the S&amp;P 500 has been close to zero over most 20-year periods, according to World Gold Council analysis. Adding even a modest allocation, typically 5% to 10% of a portfolio, can reduce overall volatility without proportionally reducing expected return. From 1971 through 2024, stocks averaged 10.7% annual returns while gold averaged 7.9%, according to Fortune<sup>3</sup>. Gold&#039;s value is not in outperforming equities over the long run, but in providing stability when equities fall.</p><h3 id="safe-haven-during-uncertainty"><a href="#safe-haven-during-uncertainty">#</a><strong>Safe haven during uncertainty</strong></h3><p>Gold is globally recognized and liquid in virtually every major market. During episodes of financial stress or geopolitical escalation, demand from central banks, institutions, and retail investors typically rises together. Central banks purchased 863 tonnes of gold in 2025, according to the World Gold Council, remaining at historically elevated levels for the fourth consecutive year. The World Gold Council&#039;s 2025 central bank survey recorded the strongest intention to continue buying gold since the survey began in 2019, and purchasing is forecast to remain close to that level through 2026<sup>5</sup>.</p><h3 id="liquidity"><a href="#liquidity">#</a><strong>Liquidity</strong></h3><p>Physical gold can be sold in most countries at market price. Gold ETFs (exchange-traded funds) trade on major exchanges with high daily volumes, making them as liquid as large-cap stocks for most practical purposes. Global gold ETF holdings grew by 801 tonnes in 2025, the second strongest year on record, according to the World Gold Council. This accessibility distinguishes gold from other hard assets such as real estate or infrastructure, which can take weeks or months to convert to cash.</p><h2 id="how-to-invest-in-gold"><a href="#how-to-invest-in-gold">#</a>How to Invest in Gold</h2><p>There are four main routes to gold exposure, each with different tradeoffs on cost, convenience, and risk.</p><ul><li><p><strong>Physical gold (bars and coins):</strong> You own the metal directly. There is no counterparty risk, but you must arrange secure storage and insurance, which adds ongoing cost. Physical gold suits investors who want outright ownership and are comfortable with those logistics.</p></li><li><p><strong>Gold ETFs:</strong> Exchange-traded funds backed by physical gold offer the simplest and lowest-cost entry point for most retail investors. They track the gold spot price closely, are held in a standard brokerage account, and carry annual management fees typically below 0.40%. They do not give you ownership of physical gold, which matters to some investors.</p></li><li><p><a href="https://www.valuethemarkets.com/analysis/market-reports-guides/guides/guide-to-investing-in-gold-mining" target="_blank"><strong>Gold mining stocks</strong></a><strong>:</strong> Shares in gold producers give leveraged exposure to the gold price. When gold rises, mining company profits can increase faster than the metal price itself. But mining stocks carry additional company-specific risk: operational issues, rising costs, and management decisions all affect returns independently of where gold trades. These are higher-risk, higher-potential-reward positions.</p></li><li><p><strong>Gold mutual funds:</strong> Actively managed funds that invest in a mix of gold producers, royalty companies, and sometimes physical gold. They offer diversification within the gold sector but typically carry higher fees than passive ETFs.</p></li></ul><p>For most retail investors, a gold ETF is the most practical starting point. Physical gold makes sense for those with strong ownership preferences and the means to store it securely. Mining stocks are suitable for investors who understand equity risk and want the potential for amplified gains.</p><h2 id="risks-to-understand-before-you-invest"><a href="#risks-to-understand-before-you-invest">#</a>Risks to Understand Before You Invest</h2><p>Gold is not a risk-free asset. Several factors can work against a gold position.</p><ul><li><p><strong>No yield or income:</strong> Gold pays no dividend and earns no interest. In a high interest rate environment, the opportunity cost of holding gold is real. When real yields (interest rates after inflation) are high, gold tends to underperform income-generating assets.</p></li><li><p><strong>Price volatility:</strong> Although gold is less volatile than many individual equities, it is not immune to sharp short-term moves. The gold price can fall significantly in response to a strong US dollar, rising real interest rates, or reduced demand from key buyers such as central banks or jewelry markets in India and China.</p></li><li><p><strong>Supply and demand dynamics:</strong> Gold demand comes from jewelry, technology, investment, and central bank buying. A drop in any of these can suppress prices regardless of broader economic conditions. Mine production is expected to rise modestly in 2026, according to the World Gold Council, which could add supply-side pressure if demand softens.</p></li><li><p><strong>Storage and insurance costs (physical gold):</strong> Holding physical gold requires either home storage (with the associated security risk) or a professional vault service, both of which carry ongoing costs that reduce net returns.</p></li><li><p><strong>Stable economy risk:</strong> Gold often underperforms in periods of strong economic growth and stable inflation. Investors who bought gold near its highs during periods of peak fear have sometimes held it for years before returning to breakeven. Timing matters.</p></li></ul><h2 id="factors-to-consider-before-you-invest"><a href="#factors-to-consider-before-you-invest">#</a>Factors to Consider Before You Invest</h2><p>Before allocating to gold, work through these questions.</p><ul><li><p><strong>Investment goals:</strong> Are you seeking long-term wealth preservation, short-term inflation protection, or portfolio diversification? Your goal determines which vehicle fits best. A conservative long-term investor and a trader trying to capitalize on near-term uncertainty will approach gold differently.</p></li><li><p><strong>Risk tolerance:</strong> Physical gold and broad gold ETFs are relatively lower-risk ways to get exposure. Shares in junior gold exploration companies sit at the opposite end of the risk spectrum. Know where you are on that scale before committing capital.</p></li><li><p><strong>Budget:</strong> Gold ETFs and mining stocks can be purchased in small amounts, making them accessible to investors with limited capital. Physical gold typically requires a larger upfront investment.</p></li><li><p><strong>Market conditions:</strong> Gold tends to perform better during periods of economic uncertainty, rising inflation, weak dollar environments, and elevated geopolitical risk. A stable, growing economy with rising real interest rates is generally a less favorable backdrop for gold.</p></li><li><p><strong>Professional advice:</strong> A regulated financial advisor can help you determine an appropriate allocation given your overall portfolio, tax position, and financial goals. This article is for informational purposes only and is not a recommendation to buy or sell any asset.</p></li></ul><h2 id="frequently-asked-questions"><a href="#frequently-asked-questions">#</a>Frequently Asked Questions</h2><h3 id="is-gold-a-good-investment-in-2026"><a href="#is-gold-a-good-investment-in-2026">#</a><strong>Is gold a good investment in 2026?</strong></h3><p>Gold has been one of the strongest performing asset classes over the past several years. As of May 2026, the price is around $4,500 per ounce, up more than 40% year-on-year. Whether it continues to rise depends on real interest rates, the US dollar, and central bank demand. JP Morgan, Deutsche Bank, and UBS have all published forecasts for gold to reach $6,000 or higher by end of 2026, though analyst forecasts carry no guarantee<sup>6</sup>. No investment is risk-free, and gold should form part of a diversified strategy rather than a standalone position.</p><h3 id="how-much-of-my-portfolio-should-be-in-gold"><a href="#how-much-of-my-portfolio-should-be-in-gold">#</a><strong>How much of my portfolio should be in gold?</strong></h3><p>There is no universal answer. Financial models and portfolio studies commonly cite 5% to 10% as a starting range for a diversification-focused allocation. Investors with a strong view on inflation or currency risk sometimes go higher. Consult a qualified financial advisor before making significant allocation decisions.</p><h3 id="what-is-the-difference-between-a-gold-etf-and-physical-gold"><a href="#what-is-the-difference-between-a-gold-etf-and-physical-gold">#</a><strong>What is the difference between a gold ETF and physical gold?</strong></h3><p>A gold ETF holds physical gold in a secure vault and issues shares that track the gold price. You get price exposure without taking possession of the metal. Physical gold gives you direct ownership but requires secure storage and insurance. Gold ETFs are easier to buy, sell, and hold within a standard investment account.</p><h3 id="does-gold-protect-against-inflation"><a href="#does-gold-protect-against-inflation">#</a><strong>Does gold protect against inflation?</strong></h3><p>Over long periods, gold has broadly tracked or outpaced inflation in real terms. However, over shorter windows, the relationship is uneven. Gold can lag inflation for extended periods before catching up. It is generally a better long-term hedge than a short-term inflation trade.</p><h2 id="what-next"><a href="#what-next">#</a><strong>What Next?</strong></h2><p>There are many reasons to invest in gold, and retail investors often opt to allocate a percentage of their portfolio to the yellow metal for the reasons mentioned above.</p><p><strong>Why not continue your investing education journey with some of our other informative articles:</strong></p><p><a href="https://www.valuethemarkets.com/analysis/investing-ideas/how-to-find-investment-opportunities" target="_blank" rel="noopener noreferrer"><strong>How to Find Investment Opportunities</strong></a></p><p><a href="https://www.valuethemarkets.com/analysis/investing-ideas/how-to-read-financial-statements" target="_blank" rel="noopener noreferrer"><strong>How to Read Financial Statements</strong></a></p><p><a href="https://www.valuethemarkets.com/analysis/investing-ideas/how-to-read-a-balance-sheet" target="_blank" rel="noopener noreferrer"><strong>How to Read a Balance Sheet</strong></a></p><p><a href="https://www.valuethemarkets.com/analysis/investing-ideas/how-to-read-a-cash-flow-statement" target="_blank" rel="noopener noreferrer"><strong>How to Read a Cash Flow Statement</strong></a></p><p><a href="https://www.valuethemarkets.com/analysis/investing-ideas/how-to-read-an-income-statement" target="_blank" rel="noopener noreferrer"><strong>How to Read an Income Statement</strong></a></p>
                ]]>
            </content>
                                                <category term="Investing Ideas" />
            
            <published>2026-05-29T05:00:00+00:00</published>
            <updated>2026-05-29T13:15:12+00:00</updated>
        </entry>
            <entry>
            <title><![CDATA[Junior Gold Producers and the Single-Asset Bet]]></title>
            <link rel="alternate" href="https://www.valuethemarkets.com/analysis/investing-ideas/junior-gold-producers" />
            <id>https://www.valuethemarkets.com/32180</id>
            <author>
                <name><![CDATA[Patricia Miller]]></name>
                        <email><![CDATA[patricia.miller@digitonic.co.uk]]></email>
                    </author>
            <summary type="html">
                <![CDATA[Junior gold producers deliver the strongest leverage to rising gold prices within the producing equity universe. A guide to evaluating the tier.]]>
            </summary>
                        <content type="html">
                <![CDATA[
                                        <p><a href="https://www.valuethemarkets.com/analysis/investing-ideas/junior-gold-producers"><img alt="Junior Gold Producers and the Single-Asset Bet" src="https://www.valuethemarkets.com/curator/d725c915-8ff0-4d45-98b2-4dcb033b8ec8.png?fm=webp&amp;q=80&amp;s=f13d602b5087cf0396d547bce7d1e82b" /></a></p>
                                        <p>Junior gold producers are the smallest companies on any meaningful <a href="https://www.valuethemarkets.com/analysis/investing-ideas/gold-stocks-to-buy-a-framework-for-gold-equities"><u>gold stocks list</u></a> that still generate revenue from gold sales. They typically operate one or two mines, produce fewer than 300,000 ounces of gold per year, and trade at market capitalisations between $200 million and $2 billion. The tier sits below mid-tier producers and above <a href="https://www.valuethemarkets.com/analysis/investing-ideas/gold-explorers-and-developers">pre-revenue explorers and developers</a>.</p><p>The defining feature is concentration. Most juniors derive their entire investment case from a single producing asset. When that asset performs, the company can deliver returns no senior or mid-tier can match. When it falters, the share price typically reflects the loss within days. This article is part of the <a href="https://www.valuethemarkets.com/analysis/investing-ideas/gold-stocks-to-buy-a-framework-for-gold-equities"><strong><u>Gold Stocks to Buy</u></strong></a> series and looks at producing juniors as a category.</p><h2 id="what-defines-a-junior-producer"><a href="#what-defines-a-junior-producer">#</a>What Defines a Junior Producer</h2><p>Junior gold producers share several structural features that distinguish them from larger gold companies. (For the purposes of this article, &#34;junior&#34; means a producing gold miner generating revenue from one or two mines, not pre-revenue explorers, those sit in a separate category covered here.)</p><p><strong>Output scale.</strong> Annual production typically falls between 50,000 and 300,000 attributable ounces of gold. Above that range, companies start to be classified as small mid-tiers. Below it, the operation often resembles a single-mine startup more than a true producer.</p><p><strong>Asset concentration.</strong> One producing mine is the norm, sometimes two. A small number of juniors operate three or more, but at that point they usually grade into mid-tier classification.</p><p><strong>Cost position varies wildly.</strong> Some juniors operate world-class deposits with all-in sustaining costs (AISC) below the senior tier average. Others run higher-cost operations that only generate margin at elevated gold prices. The dispersion is wider than at any other tier.</p><p><strong>Balance sheets are thinner.</strong> Juniors typically run with limited cash buffers, and capital projects often require equity issuance or debt that mid-tiers can fund internally. (A buffer here means the cash a company holds to absorb unexpected costs — equipment failure, ore grade variation, permit delays — without needing to raise more money.) Persistent dilution is a feature of the weaker names in the tier.</p><p><strong>M&amp;A is a structural exit.</strong> Many juniors are explicitly built to be acquired by larger producers looking to add ounces and reserves. This is a feature, not a flaw, but it means the timeline for value realisation is rarely under shareholder control.</p><h2 id="what-the-tier-offers-investors"><a href="#what-the-tier-offers-investors">#</a>What the Tier Offers Investors</h2><p><strong>Sharpest possible response to gold price moves.</strong> Junior gold mining stocks typically move 2 to 3 times as much as the gold price itself. In a rising market, this delivers outsized returns. In a falling market, it delivers outsized losses. The relationship is symmetric, and the size of the move reflects the thinness of operating margins at the junior level — a small change in the gold price translates into a large change in profit per ounce.</p><p><strong>Acquisition premium potential.</strong> When seniors and mid-tiers want to grow reserves, the cheapest route is usually to buy a junior with a producing or near-producing asset rather than to develop new ground. Acquisition premiums of 30% to 60% over the trading price are common. Investors holding junior producers are positioned to benefit from this dynamic, though the timing is unpredictable.</p><p><strong>Direct exposure to operational improvement.</strong> A 10% production increase at a senior is a rounding error. The same percentage improvement at a junior can be transformational. Junior producers offer the cleanest exposure to operational turnaround stories, mine optimisation projects, and grade improvements.</p><p><strong>Underexplored pricing.</strong> Junior gold producers are not held in size by index funds. Their share prices reflect fundamentals more than flows, which means competent analysis can identify mispriced names that mid-tier and senior investors structurally cannot access.</p><h2 id="what-to-look-for-when-evaluating-a-junior"><a href="#what-to-look-for-when-evaluating-a-junior">#</a>What to Look For When Evaluating a Junior</h2><p>The framework introduced in our <a href="https://www.valuethemarkets.com/analysis/investing-ideas/gold-stocks-to-buy-a-framework-for-gold-equities"><strong><u>Gold Stocks to Buy</u></strong></a> series applies to every tier, but it tightens significantly at the junior level because there is no diversification to absorb a mistake.</p><p><strong>Quality of the single asset.</strong> This matters more than anything else. Look at proven and probable reserves, average grade, mine life, strip ratio, and processing recovery. (Strip ratio describes how much waste rock has to be moved for each tonne of ore — a higher ratio means more cost per ounce produced.) A junior with a high-grade, long-life deposit in a stable jurisdiction is in a structurally different position than one mining low-grade ore on a six-year reserve life.</p><p><strong>Jurisdiction.</strong> Junior producers cannot diversify away from a country risk problem. A permit reversal, royalty hike, or expropriation in a junior&#039;s only operating jurisdiction is the entire investment thesis. <a href="https://www.valuethemarkets.com/analysis/investing-ideas/jurisdiction-focused-gold-stocks-and-why-geography-matters">Tier-1 jurisdictions</a> (Canada, parts of the United States, Australia) command meaningful valuation premiums for this reason.</p><p><strong>Cash position relative to capital needs.</strong> A junior with one year of cash and a major sustaining capital project ahead will issue equity. The dilution may be necessary, but it permanently reduces the share of future production accruing to existing shareholders. Look at cash, undrawn credit, capital commitments, and free cash flow generation together.</p><p><strong>Operating cost trajectory.</strong> Rising AISC at a junior is more dangerous than at any other tier. There is no offsetting low-cost asset to subsidise a struggling one. A junior whose AISC has crept up in a flat gold price environment may be one quarter away from no longer being economic.</p><p><strong>Management track record.</strong> Junior gold companies are often built around specific individuals — a CEO with a history of taking deposits to production, or a technical team with prior discoveries. Management quality matters everywhere, but at the junior level it is often the single most important non-asset variable.</p><h2 id="which-companies-sit-in-the-junior-tier"><a href="#which-companies-sit-in-the-junior-tier">#</a>Which Companies Sit in the Junior Tier</h2><p>The junior tier is broad and constantly shifting, with companies graduating up to mid-tier status, being acquired, or falling out of production. The names below illustrate the range of business models within the tier and are not an endorsement of any individual stock.</p><p><strong>Single-asset producers in production:</strong></p><p><strong>Caledonia Mining (NYSE-A: CMCL)</strong> operates the Blanket gold mine in Zimbabwe, illustrating the single-asset producer model with concentrated jurisdictional exposure.</p><p><strong>Thor Explorations (TSX-V: THX)</strong> operates the Segilola Gold Project in Nigeria, a recent transition from developer to producer.</p><p><strong>Galiano Gold (NYSE-A: GAU) (TSX: GAU)</strong> holds a 90% interest in the Asanko Gold Mine in Ghana, a clean example of single-mine West African exposure.</p><p><strong>Mako Mining (TSX-V: MKO)</strong> operates the San Albino mine in Nicaragua, illustrating Central American small-producer exposure.</p><p><strong>Jaguar Mining (TSX: JAG)</strong> operates the Turmalina and Caeté gold complexes in Brazil, a long-standing junior producer in Latin America.</p><p><strong>TRX Gold (NYSE-A: TRX)</strong> operates the Buckreef Gold Project in Tanzania, illustrating East African single-asset exposure.</p><p><strong>Asante Gold (CSE: ASE)</strong> operates gold mines in Ghana, having grown through acquisition from former senior producers.</p><p><strong>Steppe Gold (TSX: STGO)</strong> operates in Mongolia, illustrating frontier-market junior production.</p><p><strong>Turnaround and restart producers:</strong></p><p><strong>Hemlo Mining (TSX: HMMC)</strong> holds the Hemlo gold mine in Ontario, recently spun out of senior ownership and now operating as an independent junior.</p><p><strong>Luca Mining (TSX-V: LUCA)</strong> operates the Campo Morado and Tahuehueto mines in Mexico, an example of a junior built around restarted operations.</p><p><strong>Construction-stage and near-producers:</strong></p><p><strong>West Red Lake Gold Mines (TSX-V: WRLG)</strong> is restarting historic gold operations in Ontario&#039;s Red Lake district.</p><p><strong>Heliostar Metals (TSX-V: HSTR)</strong> is advancing the Ana Paula gold project in Mexico toward production.</p><p><strong>Minera Alamos (TSX-V: MAI)</strong> operates and develops gold projects in Mexico, sitting at the production-developer boundary.</p><p><strong>This list is illustrative rather than comprehensive.</strong> The junior tier contains dozens of additional names across the TSX, TSX Venture, ASX, AIM, and US small-cap exchanges, with significant variation in quality, cost position, and jurisdictional risk. Companies move in and out of the tier regularly through acquisition, production growth, or operational decline.</p><h2 id="where-the-tier-has-limits"><a href="#where-the-tier-has-limits">#</a>Where the Tier Has Limits</h2><p>Junior gold producers carry structural disadvantages that no operational excellence can fully offset.</p><p><strong>Single-asset risk is the dominant variable.</strong> A flood, fire, equipment failure, geotechnical incident, or grade shortfall at a junior&#039;s only producing mine can wipe out the investment thesis in a single quarter. Senior and <a href="https://www.valuethemarkets.com/analysis/investing-ideas/mid-tier-gold-miners-what-to-know-about-the-growth-tier">mid-tier producers</a> absorb these events because other mines keep producing. Juniors do not have that buffer.</p><p><strong>Jurisdictional shocks are unhedged.</strong> A change in royalty regime, permit framework, or political stability in a junior&#039;s host country affects 100% of production. The same shock at a senior with operations across five continents affects a fraction.</p><p><strong>Funding risk is persistent.</strong> Juniors often need to raise capital for expansion, exploration, or sustaining capital. In strong gold markets, this is straightforward. In weak ones, it requires dilutive equity issuance at depressed prices, which permanently impairs shareholder value. Junior financing windows can close abruptly during weak commodity markets or broader equity selloffs, regardless of underlying asset quality.</p><p><strong>Liquidity can disappear.</strong> Junior gold mining stocks trade thinly compared to seniors. In market stress, bid-ask spreads widen, volume dries up, and selling at anything close to the screen price becomes difficult. Thin liquidity can amplify both upside and downside, particularly in smaller TSX Venture-listed names where institutional ownership is limited. This is structural, not occasional.</p><p><strong>Acquisition timing is not yours to choose.</strong> Being acquired by a larger producer usually delivers a premium, but at a price and on a timeline set by the acquirer, not the shareholder. A junior may receive a takeout bid years after a shareholder bought in, at a price below what the same shareholder would have set as their fair value.</p><p><strong>Operational reporting is thinner.</strong> Juniors typically have smaller investor relations functions, less analyst coverage, and less frequent operational updates than seniors and mid-tiers. Information asymmetry between management and shareholders is structurally higher.</p><h2 id="the-bottom-line-on-the-junior-tier"><a href="#the-bottom-line-on-the-junior-tier">#</a>The Bottom Line on the Junior Tier</h2><p>Junior gold producers offer the most concentrated possible exposure to a rising gold price within the producing equity universe. The tier rewards selection more than any other with dispersion between the best and worst junior gold producers in a single year regularly exceeding the move in gold itself.</p><p>For investors who already hold senior and mid-tier exposure and want a sharper response to gold price moves, a small allocation to carefully selected juniors can complement the rest of the portfolio. For investors building a position from scratch, the junior tier should not be the starting point. The concentration risk that defines the tier requires either professional research capacity or comfort with binary outcomes that most retail investors do not have.</p><p>The next article in <strong>this series</strong> moves to <a href="https://www.valuethemarkets.com/analysis/investing-ideas/gold-royalty-and-streaming-and-the-asset-light-model">gold royalty and streaming companies</a>, which offer exposure to gold mining without the operational risk that defines the junior tier.</p><p>For readers new to the mechanics of how gold companies actually generate margin, our <a href="https://www.valuethemarkets.com/analysis/market-reports-guides/guides/guide-to-investing-in-gold-mining"><strong><u>guide to investing in gold mining</u></strong></a> covers the operational fundamentals in detail.</p>
                ]]>
            </content>
                                                <category term="Investing Ideas" />
            
            <published>2026-05-12T08:27:09+00:00</published>
            <updated>2026-05-29T07:16:21+00:00</updated>
        </entry>
            <entry>
            <title><![CDATA[AI Agent Payment Infrastructure Explained]]></title>
            <link rel="alternate" href="https://www.valuethemarkets.com/analysis/investing-ideas/ai-agent-payment-infrastructure-explained" />
            <id>https://www.valuethemarkets.com/30398</id>
            <author>
                <name><![CDATA[Patrick Davis]]></name>
                        <email><![CDATA[naz.shamlian@digitonic.co.uk]]></email>
                    </author>
            <summary type="html">
                <![CDATA[Learn how AI agent payment infrastructure works, why it matters for blockchain investors, and what risks and metrics to watch as adoption grows.]]>
            </summary>
                        <content type="html">
                <![CDATA[
                                        <p><a href="https://www.valuethemarkets.com/analysis/investing-ideas/ai-agent-payment-infrastructure-explained"><img alt="AI Agent Payment Infrastructure Explained" src="https://www.valuethemarkets.com/curator/media/4ee799aa-95fc-411a-9812-05ee00b11161.png?fm=webp&amp;q=80&amp;s=4dc4c37ffd374bfa749d8855558c15a2" /></a></p>
                                        <h2 id="how-ai-agent-payment-infrastructure-works-and-why-investors-should-watch-it"><a href="#how-ai-agent-payment-infrastructure-works-and-why-investors-should-watch-it">#</a>How AI Agent Payment Infrastructure Works and Why Investors Should Watch It</h2><p>Autonomous software is beginning to transact. AI agents, programs that operate without direct human instruction, are being designed to hold balances, pay for services, and settle obligations on programmable payment rails. This is not a hypothetical. Early commercial deployments are experimenting with machine-to-machine payments through blockchain infrastructure, though public data on agent-attributable transaction volume remains limited and methodologies vary.</p><p>For investors tracking <a href="https://www.valuethemarkets.com/analysis/market-reports-guides/guides/where-value-accrues-in-blockchain-infrastructure" target="_blank">blockchain infrastructure</a>, this matters for a specific reason. Every other demand driver in the sector, including stablecoin adoption, real-world asset tokenization, and cross-border payments, involves humans at the point of value transfer. AI agent payments introduce a structurally different source of transaction flow: software initiating and settling transactions autonomously, at machine speed, and potentially at massive scale. The infrastructure layers that serve these agents stand to capture recurring fee revenue tied to AI usage growth rather than to human financial behavior.</p><p>Understanding what this layer is, how it earns, and what risks surround it is essential groundwork for evaluating any investment exposure to this part of the blockchain infrastructure stack.</p><h2 id="what-is-ai-agent-payment-infrastructure"><a href="#what-is-ai-agent-payment-infrastructure">#</a>What Is AI Agent Payment Infrastructure?</h2><p>AI agent payment infrastructure refers to the protocols, wallets, and payment rails that enable autonomous software agents to hold digital assets and execute financial transactions without human involvement at the point of payment.</p><p>A conventional payment requires a human to authorize the transaction, whether by tapping a card, approving a wire, or clicking a button. An AI agent operating on programmable rails can complete the same action autonomously. It identifies a required service, checks its balance, initiates a payment, and confirms settlement, all within a single automated workflow.</p><p>Most current implementations remain limited to narrow or supervised environments, such as API marketplaces, inference billing, or pre-authorized spending constraints rather than unrestricted commercial autonomy.</p><h3 id="core-infrastructure-components"><a href="#core-infrastructure-components">#</a>Core Infrastructure Components</h3><p><strong>The building blocks are:</strong></p><p><strong>Programmable wallets.</strong> Smart contract-based (blockchain-executed) wallets that an agent can control using cryptographic keys, without a human counterparty. These wallets can hold stablecoins or other digital assets and execute spending rules set in code.</p><p><strong>Stablecoin settlement.</strong> Most current deployments use dollar-pegged stablecoins (tokens backed by fiat reserves) because agents need price stability. Volatile assets introduce settlement risk into automated workflows.</p><p><strong>On-chain payment rails.</strong> The network infrastructure that routes, validates, and settles the transactions. Fees accrue at each layer the payment touches.</p><p><strong>Agent identity and credentialing protocols.</strong> Emerging standards that allow a receiving counterparty to verify that a payment originates from a legitimate, authorized agent rather than a malicious script.</p><p>Within the broader blockchain infrastructure stack, this layer sits above the payment rails and below the application layer. It depends on stablecoin issuers for the assets, Layer 1 and Layer 2 networks for settlement, and oracle infrastructure, systems that feed external pricing and real-world data into blockchain applications.</p><h2 id="why-it-matters-for-investors"><a href="#why-it-matters-for-investors">#</a>Why It Matters for Investors</h2><p>The investor case for AI agent payment infrastructure rests on one structural argument: if AI software adoption continues at its current trajectory, machine-initiated transaction volume could become significant within certain categories of digital payments, particularly high-frequency API and microservice transactions.</p><p>That creates a leverage effect. The underlying infrastructure, validators, payment rails, stablecoin issuers, and oracles, earns fees on every transaction regardless of whether a human or an agent originated it. A network that currently serves 10 million human users would see its fee revenue expand dramatically if each of those users deploys one or more agents transacting on their behalf.</p><h3 id="where-the-fees-accrue"><a href="#where-the-fees-accrue">#</a>Where the Fees Accrue</h3><p>The valuation implication is that fee revenue from this layer is additive rather than substitutive. Agents do not replace human transaction flows; they layer on top of them. Infrastructure that captures both streams has a larger total addressable market than infrastructure priced on human usage alone.</p><p>Capital flows are beginning to reflect this. Investor interest in agent infrastructure and agent-native payment protocols increased through 2024 and into 2025, with several venture-backed startups and infrastructure initiatives emerging in the sector. Traditional asset managers evaluating digital infrastructure exposure increasingly flag AI agent transaction volume as a watch metric alongside stablecoin supply and daily active addresses.</p><h2 id="key-drivers-and-components"><a href="#key-drivers-and-components">#</a>Key Drivers and Components</h2><h3 id="demand-drivers"><a href="#demand-drivers">#</a><strong>Demand Drivers</strong></h3><p>The primary driver is the number of AI agents actively running in production environments. As enterprises integrate agents into workflows, including procurement, content delivery, data services, and API consumption, the agents require payment capability. Each deployed agent is a potential fee-generating transaction node.</p><p>Stablecoin availability is a second driver. Agents require a stable unit of account for predictable cost calculations. The growth of licensed, regulated stablecoins directly enables agent payment deployments. Jurisdictions with clear stablecoin frameworks are likely to see earlier and larger agent payment volumes.</p><p>Developer tooling and standards also shape adoption pace. Protocols that provide simple, well-documented agent payment APIs attract faster integration than those requiring custom engineering.</p><h3 id="supply-factors"><a href="#supply-factors">#</a><strong>Supply Factors</strong></h3><p>Multiple blockchain networks and Layer 2 solutions are positioning for agent payment volume. Fees will compress in layers without strong network effects or switching costs. Rails with existing stablecoin liquidity and deep developer ecosystems have a structural advantage.</p><p>The absence of standardized agent identity and credentialing is a current constraint. Without a reliable way to verify agent authorization, counterparties face fraud risk, limiting adoption in higher-value use cases.</p><h2 id="early-commercial-use-cases"><a href="#early-commercial-use-cases">#</a>Early Commercial Use Cases</h2><p>The earliest commercial agent payment deployments emerged from AI API marketplaces, where software agents pay per-call fees to access data, compute, or model inference. For example, an AI coding agent could automatically pay for additional model inference or third-party data access while completing a software task. Platforms facilitating this model began routing payments through stablecoin rails in 2024, using smart contract wallets to handle micro-payment settlement that would be uneconomic over traditional banking infrastructure.</p><p>By early 2025, some infrastructure providers and protocol teams began publishing preliminary estimates of agent-related transaction activity, though reporting standards remain inconsistent. While absolute volumes remain small relative to total stablecoin settlement, the growth rate has attracted attention from analysts covering both AI infrastructure and digital payments. The Coinbase-affiliated Base network and Solana have both been cited by developers as early rails of choice for experimental agent payment workloads, particularly micropayment and API-payment use cases, largely due to low per-transaction fees and high throughput.</p><p>The pattern mirrors early stablecoin adoption: volumes begin in technically sophisticated, developer-driven use cases and migrate toward broader commercial deployment as tooling matures and regulatory clarity improves.</p><h2 id="risks-and-limitations"><a href="#risks-and-limitations">#</a>Risks and Limitations</h2><p>AI agent transaction volumes are currently small. Infrastructure valuations pricing in large future agent flows face significant execution risk if AI adoption slows, agent deployments underperform expectations, or the use cases prove narrower than projected.</p><h3 id="security-and-regulatory-risks"><a href="#security-and-regulatory-risks">#</a>Security and Regulatory Risks</h3><p>Autonomous agents executing financial transactions also create new attack surfaces. Prompt injection attacks (manipulating an agent&#039;s instructions to redirect payments) and compromised agent keys represent material risks. A high-profile exploit could slow enterprise adoption significantly.</p><p>No standardized protocol yet governs how a receiving party verifies an agent&#039;s authorization to spend. Until that gap closes, high-value commercial deployments will remain limited.</p><p>Regulatory uncertainty adds further risk. It is unclear how payments initiated by software rather than natural persons will be treated under anti-money-laundering, travel rule, and consumer protection regimes. Regulatory rulings that apply human payment standards to agent transactions could impose compliance costs that make some use cases unviable. Some legal analysts expect regulators to initially treat many agent payments as delegated or programmatic payment authorizations rather than as a wholly separate payment category.</p><p>Finally, a small number of developer platforms and wallet providers currently handle most agent payment integrations. Disruption to any of them would affect the broader adoption curve.</p><h2 id="how-investors-track-this"><a href="#how-investors-track-this">#</a>How Investors Track This</h2><p>Some analysts and community dashboards attempt to estimate agent-attributable transaction flows using heuristics, though no industry-standard classification methodology currently exists.</p><p>Because stablecoins are the dominant settlement asset for agent payments, overall stablecoin supply remains a leading indicator for addressable volume. Developer activity metrics, including GitHub commit counts, protocol documentation updates, and SDK download figures for agent payment tooling, give early signal on adoption pace ahead of transaction data.</p><p>Venture and institutional capital flows are a further signal. Funding rounds targeting agent-native payment infrastructure and wallet protocols indicate where institutional money is positioning. Pitchbook and Crunchbase track these at the deal level.</p><p>For listed or tokenized infrastructure protocols, fee revenue attributable to agent workloads is the cleanest measure of commercial traction. Watch for protocol teams disaggregating agent fees in their reporting as volumes grow.</p><h2 id="related-concepts"><a href="#related-concepts">#</a>Related Concepts</h2><p>AI agent payment infrastructure is one part of the broader economics of <a href="https://www.valuethemarkets.com/analysis/market-reports-guides/guides/where-value-accrues-in-blockchain-infrastructure">blockchain infrastructure</a>, where fee revenue accrues differently across settlement layers, middleware, and asset rails depending on usage intensity and switching costs.</p><p>Investors researching this topic will find adjacent depth in these related areas: stablecoin payment rails and how issuers monetize reserve yield; Layer 2 scaling economics and how rollup fees flow back to base chains; oracle infrastructure and its role in pricing agent transactions; and the tokenization of real-world assets, which represents a parallel institutional use case for the same programmable payment rails.</p><p>Whether AI agent payments become a major transaction category or remain niche infrastructure, investors should watch where autonomous transaction volume accumulates. The networks and payment rails capturing that activity could become important beneficiaries of AI commercialization over the next decade.</p><h2 id="frequently-asked-questions"><a href="#frequently-asked-questions">#</a>Frequently Asked Questions</h2><h3 id="what-is-an-ai-agent-payment"><a href="#what-is-an-ai-agent-payment">#</a>What is an AI agent payment?</h3><p>An AI agent payment is a financial transaction initiated and executed by autonomous software without human approval at the point of transfer. The agent holds a digital wallet, determines the payment amount, and settles the transaction on a blockchain payment rail, typically using a stablecoin as the settlement asset.</p><h3 id="why-do-ai-agents-use-stablecoins-rather-than-other-assets"><a href="#why-do-ai-agents-use-stablecoins-rather-than-other-assets">#</a>Why do AI agents use stablecoins rather than other assets?</h3><p>Stablecoins provide price stability, which agents require to calculate costs predictably. Using a volatile asset would introduce settlement risk into automated workflows because the value of the payment could change between the time the agent commits and the time the transaction settles.</p><h3 id="is-ai-agent-transaction-volume-large-enough-to-affect-infrastructure-valuations-today"><a href="#is-ai-agent-transaction-volume-large-enough-to-affect-infrastructure-valuations-today">#</a>Is AI agent transaction volume large enough to affect infrastructure valuations today?</h3><p>Not materially, at present. Current volumes are small relative to total stablecoin settlement. The investment case rests on projected future volume rather than current contribution to fee revenue. Investors should weigh that execution risk explicitly when evaluating infrastructure assets priced on agent payment growth.</p><h3 id="how-does-agent-payment-infrastructure-earn-revenue"><a href="#how-does-agent-payment-infrastructure-earn-revenue">#</a>How does agent payment infrastructure earn revenue?</h3><p>Revenue accrues at multiple points in the stack. The stablecoin issuer earns yield on reserves. The payment rail earns a per-transaction fee. The underlying Layer 1 or Layer 2 network earns a settlement fee. Wallet and credentialing protocol providers may earn subscription or per-activation fees. A single agent payment can generate revenue for several infrastructure layers simultaneously.</p><h3 id="what-regulatory-questions-remain-unresolved-for-ai-agent-payments"><a href="#what-regulatory-questions-remain-unresolved-for-ai-agent-payments">#</a>What regulatory questions remain unresolved for AI agent payments?</h3><p>The primary open questions concern how anti-money-laundering obligations, travel rule requirements (rules requiring the transfer of payer and payee information alongside transactions), and consumer protection frameworks apply when the paying party is software rather than a natural person. Regulatory guidance in this area is developing in the US, EU, and Singapore, but no jurisdiction has yet issued comprehensive rules specific to AI-initiated payments.</p>
                ]]>
            </content>
                                                <category term="Investing Ideas" />
            
            <published>2026-05-21T09:49:40+00:00</published>
            <updated>2026-05-21T10:27:52+00:00</updated>
        </entry>
            <entry>
            <title><![CDATA[How Cross-Chain Bridges Work and Why They Matter to Investors]]></title>
            <link rel="alternate" href="https://www.valuethemarkets.com/analysis/investing-ideas/cross-chain-bridges-interoperability-investors" />
            <id>https://www.valuethemarkets.com/30392</id>
            <author>
                <name><![CDATA[Patrick Davis]]></name>
                        <email><![CDATA[naz.shamlian@digitonic.co.uk]]></email>
                    </author>
            <summary type="html">
                <![CDATA[Cross-chain bridges move assets between blockchains and earn fees on every transfer. Learn how they work, where risk concentrates, and what investors should track.]]>
            </summary>
                        <content type="html">
                <![CDATA[
                                        <p><a href="https://www.valuethemarkets.com/analysis/investing-ideas/cross-chain-bridges-interoperability-investors"><img alt="How Cross-Chain Bridges Work and Why They Matter to Investors" src="https://www.valuethemarkets.com/curator/media/2812e734-07a8-458c-9260-1b26bbd9d8c6.png?fm=webp&amp;q=80&amp;s=28e98475a1be5c42a53285fd08fde69e" /></a></p>
                                        <p>As blockchain infrastructure has matured into a multi-chain environment, the ability to move assets and data between separate networks has become a foundational requirement. Cross-chain interoperability refers to the protocols and mechanisms that allow tokens, messages, and instructions to travel between blockchains that do not natively communicate with each other.</p><p>For investors, this layer of the stack is worth understanding for two reasons. First, it sits in the path of a large and growing volume of value transfer. Every dollar moving from Ethereum to a Layer 2 network, or from one chain to another for yield or trading purposes, typically passes through an interoperability protocol that earns a fee on the flow. Second, bridges have historically been among the highest-risk components of blockchain infrastructure, accounting for a significant share of major crypto exploit losses. That combination of fee opportunity and concentrated technical risk makes the category material to any serious analysis of blockchain infrastructure economics.</p><h2 id="what-is-cross-chain-interoperability"><a href="#what-is-cross-chain-interoperability">#</a>What Is Cross-Chain Interoperability?</h2><p>Cross-chain interoperability is the capacity of two or more independent blockchain networks to exchange assets or information in a trustworthy way. Because blockchains are closed systems by design, they cannot natively read the state of another chain. Interoperability protocols bridge that gap.</p><p>A bridge, in the context of <a href="https://www.valuethemarkets.com/analysis/market-reports-guides/guides/where-value-accrues-in-blockchain-infrastructure">blockchain infrastructure</a>, is a protocol that locks or burns an asset on a source chain and issues a corresponding representation of that asset on a destination chain. In many bridge designs, the user receives a ‘wrapped’ or synthetic representation of the original asset on the destination chain, although some liquidity-network designs deliver native assets directly.</p><p>There are several architectural approaches. Lock-and-mint bridges hold the original asset in a smart contract on the source chain and mint a synthetic equivalent on the destination. Burn-and-release bridges destroy the synthetic on the destination and release the original on the source. Liquidity-network bridges match users directly against pools of assets on both chains, avoiding synthetic tokens altogether. Intent-based protocols are a newer design where users specify a desired outcome (for example, receiving a specific token on a specific chain) and a network of solvers competes to fill the order optimally.</p><p>Messaging protocols extend interoperability beyond asset transfers. They allow smart contracts on one chain to trigger actions on another, enabling cross-chain governance, yield strategies, and application logic that spans multiple networks.</p><h2 id="why-it-matters-for-investors"><a href="#why-it-matters-for-investors">#</a>Why It Matters for Investors</h2><p>Interoperability infrastructure earns fees directly from the volume of assets and messages it routes. As blockchain activity has distributed across dozens of networks rather than concentrating on a single chain, the aggregate flow that must cross chain boundaries has grown substantially.</p><p>For investors evaluating specific protocols, the interoperability layer raises questions about take rate (the share of transferred value captured as fees), competitive moat, and risk profile. A bridge that routes high volumes but charges minimal fees may be building network effects at the cost of near-term revenue. A bridge that charges meaningful fees but faces low switching costs may lose volume quickly to cheaper alternatives.</p><p>The layer also affects the valuations of chains above and below it. A Layer 1 or Layer 2 network that receives significant inbound liquidity through bridge integrations benefits from higher on-chain activity and fee revenue. A network that is poorly connected loses users who want to move capital freely between ecosystems.</p><h2 id="key-drivers-and-components"><a href="#key-drivers-and-components">#</a>Key Drivers and Components</h2><h3 id="volume-and-liquidity-depth"><a href="#volume-and-liquidity-depth">#</a>Volume and Liquidity Depth</h3><p>Bridge revenue is primarily a function of transfer volume. Volume is driven by yield differentials between chains, trading opportunities, application launches on new networks, and shifts in user activity following changes in gas fees or incentive programs. Bridges with deeper liquidity pools can fill large transfers without significant slippage, attracting institutional and high-value users.</p><h3 id="protocol-design-and-trust-model"><a href="#protocol-design-and-trust-model">#</a>Protocol Design and Trust Model</h3><p>Different bridge architectures carry different trust assumptions. Externally validated bridges rely on a set of validators or a multisig (a security mechanism requiring multiple parties to authorize a transaction) to attest that a transfer occurred. Natively verified bridges use cryptographic proofs, such as zero-knowledge proofs, to verify transfers without trusting any external party. Light-client bridges run a simplified version of one chain&#039;s consensus on another, offering strong security at higher computational cost. Investors should distinguish between these models because their security profiles differ materially.</p><h3 id="competitive-dynamics"><a href="#competitive-dynamics">#</a>Competitive Dynamics</h3><p>The bridge market is fragmented. Dozens of protocols compete on fees, speed, supported assets, and the number of chains they connect. Aggregators now route users to the cheapest or fastest option across multiple bridges, compressing margins for individual providers. Protocols that integrate natively into wallets, applications, or major chains hold a structural distribution advantage.</p><h3 id="macro-and-ecosystem-factors"><a href="#macro-and-ecosystem-factors">#</a>Macro and Ecosystem Factors</h3><p>Bridge volume tends to correlate with overall on-chain activity. Bull markets, new chain launches, large application deployments, and stablecoin growth all drive cross-chain flows. Regulatory treatment of wrapped assets (synthetic tokens issued on the destination chain) is an emerging variable that could affect how institutional users engage with bridge infrastructure.</p><h2 id="real-world-context"><a href="#real-world-context">#</a>Real-World Context</h2><p>Bridge exploits have been among the largest single-incident losses in the history of blockchain infrastructure. The Ronin bridge attack in 2022 resulted in losses of approximately $625 million, according to public post-mortems from the Ronin team and blockchain analytics firm Chainalysis. The Wormhole exploit earlier that year cost approximately $320 million. The Nomad bridge attack in the same year added roughly $190 million to the total.</p><p>These events established a pattern. Bridges that custody large pools of assets in smart contracts become high-value targets. A vulnerability in the contract logic, a compromised validator key set, or an error in the proof verification system can allow an attacker to drain the locked assets without triggering the corresponding burn on the destination chain.</p><p>The industry response has included a shift toward natively verified designs, more extensive auditing, and bug bounty programs. Several protocols now use cryptographic verification systems, including zero-knowledge proofs and light-client architectures, to reduce reliance on external validators. These designs are computationally heavier but materially reduce the attack surface.</p><h2 id="risks-and-limitations"><a href="#risks-and-limitations">#</a>Risks and Limitations</h2><p>Smart contract risk is the defining risk of this layer. Bridges hold or route large pools of assets, making them attractive targets. Even audited contracts have been exploited. Investors should treat the security track record of a specific protocol as a primary due diligence input, not a secondary one.</p><p>Validator and key management risk affects externally validated bridges. If a threshold of validator keys is compromised or if the validator set is small and poorly distributed, an attacker can forge attestations and drain bridge contracts. Several major exploits followed exactly this pattern.</p><p>Liquidity risk affects bridges that use pooled liquidity. If a pool on the destination chain is depleted, users may face delays or be unable to complete transfers at all. This risk is amplified during periods of high market volatility when multiple users attempt large transfers simultaneously.</p><p>Wrapped asset risk affects users on the destination chain. A wrapped token is only as good as the bridge that issued it. If the bridge is exploited, the wrapped token may lose its peg to the underlying asset. Holders of wrapped tokens bear the credit risk of the issuing protocol.</p><p>Regulatory uncertainty around wrapped assets and synthetic representations of securities could affect the addressable market for bridge protocols, particularly as tokenized real-world assets grow in scale.</p><h2 id="how-investors-track-this"><a href="#how-investors-track-this">#</a>How Investors Track This</h2><p>Bridge-specific metrics are available from on-chain analytics platforms. Key indicators include total value locked (the assets held in bridge contracts or liquidity pools), daily transfer volume by chain pair, fee revenue by protocol, and the concentration of volume across bridge providers.</p><p>Platforms such as DefiLlama publish bridge volume and TVL data by protocol. Token Terminal tracks fee revenue for protocols that have publicly available fee structures. Dune Analytics hosts community-built dashboards covering specific bridge metrics.</p><p>Security-focused sources include audit reports published by firms such as Trail of Bits, OpenZeppelin, and Certik. Post-exploit analyses from Chainalysis and on-chain security researchers provide historical context on loss events.</p><p>For protocols that issue governance tokens, on-chain governance activity and treasury disclosures offer insight into how protocol development is funded and prioritized.</p><h2 id="related-concepts"><a href="#related-concepts">#</a>Related Concepts</h2><p>Cross-chain interoperability sits within the broader context of how value moves through the <a href="https://www.valuethemarkets.com/analysis/market-reports-guides/guides/where-value-accrues-in-blockchain-infrastructure">blockchain infrastructure stack</a>. Layer 2 scaling networks, which process transactions off the base chain and settle them back to it, are among the largest users of bridge infrastructure. Understanding the economics of Layer 2 networks is a natural complement to analyzing bridges. Related areas worth exploring include validator and staking economics, which underpin the security models of several bridge designs; the role of oracles in supplying price data for cross-chain transactions; and the tokenization of real-world assets, where cross-chain portability is an increasingly important design requirement for institutional issuers.</p><h2 id="faq"><a href="#faq">#</a>FAQ</h2><h4>What is a blockchain bridge?</h4><p>A blockchain bridge is a protocol that allows assets or data to move between two separate blockchain networks. It typically works by locking an asset on the source chain and issuing a corresponding token on the destination chain, or by matching users against liquidity pools that hold assets on both sides.</p><h4>Why are bridges considered high-risk?</h4><p>Bridges concentrate large pools of assets in smart contracts or validator-controlled addresses. A vulnerability in the contract code or a compromise of validator keys can allow an attacker to drain those assets without triggering the corresponding token burn on the destination chain. Several of the largest single-incident losses in blockchain history occurred through bridge exploits.</p><h4>What is the difference between an externally validated and a natively verified bridge?</h4><p>An externally validated bridge relies on a set of validators or a multisig to confirm that a transfer occurred on the source chain. A natively verified bridge uses cryptographic proofs, typically zero-knowledge proofs, to verify transfers mathematically without trusting any third party. Natively verified designs are generally considered more secure but require more computational overhead.</p><h4>How do bridge protocols generate revenue?</h4><p>Most bridges charge a fee on each transfer, typically expressed as a percentage of the transferred amount or a fixed fee per transaction. Some protocols earn additional revenue from liquidity provision incentives or from MEV (maximal extractable value), referring to value captured through transaction ordering and routing, captured during transaction routing.</p><h4>Is bridge volume a useful indicator of ecosystem health?</h4><p>Bridge inflows to a specific chain can indicate growing user and developer activity, as new capital is required to participate in that ecosystem. Sustained outflows may signal declining interest. However, volume can also reflect short-term incentive programs or arbitrage activity rather than organic growth, so it is best interpreted alongside other on-chain metrics such as active addresses and application-level fee revenue.</p>
                ]]>
            </content>
                                                <category term="Investing Ideas" />
            
            <published>2026-05-21T09:29:54+00:00</published>
            <updated>2026-05-21T09:42:01+00:00</updated>
        </entry>
            <entry>
            <title><![CDATA[Senior Gold Producers and What They Offer Investors]]></title>
            <link rel="alternate" href="https://www.valuethemarkets.com/analysis/investing-ideas/senior-gold-producers" />
            <id>https://www.valuethemarkets.com/29005</id>
            <author>
                <name><![CDATA[Patricia Miller]]></name>
                        <email><![CDATA[patricia.miller@digitonic.co.uk]]></email>
                    </author>
            <summary type="html">
                <![CDATA[Senior gold producers offer the cleanest equity exposure to gold. A framework for understanding what defines the tier and which names sit in it.]]>
            </summary>
                        <content type="html">
                <![CDATA[
                                        <p><a href="https://www.valuethemarkets.com/analysis/investing-ideas/senior-gold-producers"><img alt="Senior Gold Producers and What They Offer Investors" src="https://www.valuethemarkets.com/curator/media/gold-nuggets.png?fm=webp&amp;q=80&amp;s=6123a10316253a75da8a59f10555c1e9" /></a></p>
                                        <h2 id="the-case-for-starting-with-the-seniors"><a href="#the-case-for-starting-with-the-seniors">#</a>The Case for Starting With the Seniors</h2><p>The senior tier sits at the top of every gold stocks list for a reason. Senior gold producers offer the most direct, lowest-friction equity exposure to a rising gold price, supported by the largest reserve bases, the most diversified mine portfolios, and the lowest unit costs in the listed gold mining universe. For investors looking for gold exposure that behaves predictably across cycles, the senior tier is almost always the starting point.</p><p>This article is part of the <a href="https://www.valuethemarkets.com/analysis/investing-ideas/gold-stocks-to-buy-a-framework-for-gold-equities" rel="noopener noreferrer nofollow">Gold Stocks to Buy</a> series and surveys the senior tier as a category. It does not recommend any individual stock. It explains what defines a senior gold producer, what the tier offers investors, what to look for when evaluating one, and which gold companies currently sit in the category.</p><h2 id="what-defines-a-senior-gold-producer"><a href="#what-defines-a-senior-gold-producer">#</a>What Defines a Senior Gold Producer</h2><p>There is no formal regulatory definition, but the industry generally treats a senior as a gold mining company producing more than approximately 1.5 to 2 million attributable ounces of gold per year, with operations spanning multiple continents and mines. (Attributable ounces means the company&#039;s share of production from mines it owns outright plus its proportional share from joint ventures.)</p><p>The defining characteristics are scale, diversification, and balance sheet capacity. Senior gold producers typically operate between 8 and 20 producing mines across at least three or four jurisdictions. They generate sufficient cash flow to fund sustaining capital, growth projects, dividends, and share repurchases simultaneously, without relying on equity issuance. Their reserve base spans decades rather than years.</p><p>This combination is structurally unavailable to <a href="https://www.valuethemarkets.com/analysis/investing-ideas/mid-tier-gold-miners-what-to-know-about-the-growth-tier">mid-tier</a> and <a href="https://www.valuethemarkets.com/analysis/investing-ideas/junior-gold-producers">junior gold mining stocks</a>. It is the entire reason the senior tier exists as a separate category.</p><p>Compared with mid-tier and junior gold mining stocks, senior producers trade some upside potential for lower operational risk, stronger balance sheets, and greater diversification.</p><h2 id="what-the-tier-offers-investors"><a href="#what-the-tier-offers-investors">#</a>What the Tier Offers Investors</h2><p><strong>Lower unit costs.</strong> Senior producers consistently report all-in sustaining costs (AISC) below the industry average. AISC measures the total cash cost of producing each ounce of gold, including operating expenses, sustaining capital, and a share of corporate overhead. Lower AISC means more margin per ounce when the gold price rises, and more resilience when it falls.</p><p><strong>Operational diversification.</strong> A single mine setback at a senior producer affects a small share of total production. The same setback at a single-asset junior can wipe out the entire investment thesis. Diversification across geography, ore type, and mine maturity is the senior tier&#039;s most underappreciated advantage.</p><p><strong>Capital return capacity.</strong> Senior gold producers fund dividends and buybacks from operating cash flow, not from balance sheet drawdowns or asset sales. This is mathematically unavailable to smaller gold companies, whose free cash flow is consumed by sustaining capital and growth projects.</p><p><strong>Cycle resilience.</strong> Gold cycles are long and brutal. Companies that enter downturns with cash and low debt exit them with assets purchased cheaply from distressed competitors. Senior producers are the typical buyers in those acquisitions, not the targets.</p><h2 id="what-to-look-for-when-evaluating-a-senior"><a href="#what-to-look-for-when-evaluating-a-senior">#</a>What to Look For When Evaluating a Senior</h2><p>The framework introduced in the <a href="https://www.valuethemarkets.com/analysis/investing-ideas/gold-stocks-to-buy-a-framework-for-gold-equities" rel="noopener noreferrer nofollow"><strong>Gold Stocks to Buy</strong></a> article applies to every gold stock tier, but its emphasis shifts in the senior tier:</p><p><strong>Reserve quality and mine life.</strong> Look at proven and probable reserves divided by current annual production. (Proven and probable reserves are the gold a company has demonstrated it can mine economically, verified through drilling and engineering studies.) A senior with 15 to 20 years of reserve life at current production is in materially better shape than one at 8 to 10 years, because the latter must either replace reserves through exploration success or grow through acquisition.</p><p><strong>Cost discipline trajectory.</strong> A single year&#039;s AISC tells you little. The trend over five years tells you whether management is genuinely controlling costs or letting inflation, declining grade, and aging assets erode the margin advantage. Rising AISC in a flat gold price environment is a warning sign at any tier, but it matters most at the senior level because the entire investment case rests on cost leadership.</p><p><strong>Capital allocation history.</strong> Senior gold producers have more options than smaller companies — buybacks, dividends, growth capital, M&amp;A, debt repayment. Track which option management has chosen historically, and whether those choices created or destroyed shareholder value. Gold mining acquisition history is full of value-destructive deals struck near cycle peaks.</p><p><strong>Jurisdictional mix.</strong> Even seniors carry geographic risk. Operations in Papua New Guinea, Mali, Tanzania, or parts of Latin America have produced material write-downs, royalty disputes, and permit reversals across the sector. Look at where each company&#039;s flagship assets sit and what proportion of production comes from <a href="https://www.valuethemarkets.com/analysis/investing-ideas/jurisdiction-focused-gold-stocks-and-why-geography-matters">stable jurisdictions</a>.</p><p><strong>Reserve replacement ratio.</strong> This is the volume of new reserves added in a year divided by the volume mined. A senior consistently replacing 100% or more of mined reserves is sustainable. One running below 70% for several years is structurally shrinking, regardless of what current production figures suggest.</p><h2 id="which-companies-sit-in-the-senior-tier"><a href="#which-companies-sit-in-the-senior-tier">#</a>Which Companies Sit in the Senior Tier</h2><p>The senior tier is small. Globally, only a handful of gold companies meet the production scale, diversification, and balance sheet thresholds.</p><p><strong>Newmont Corporation (NYSE: NEM) </strong>is the world&#039;s largest gold producer by output, with managed operations across North America, South America, Australia, Africa, and Papua New Guinea. Newmont is the cleanest reference point for understanding what scale delivers in the senior tier, and we cover its operating model in detail in <a href="https://www.valuethemarkets.com/analysis/investing-ideas/newmont-nyse-nem-shows-what-scale-buys-in-gold-mining" target="_blank" rel="noopener noreferrer nofollow" class="underline underline underline-offset-2 decoration-1 decoration-current/40 hover:decoration-current focus:decoration-current"><strong>Newmont Shows What Scale Buys in Gold Mining</strong></a><a href="https://www.valuethemarkets.com/analysis/investing-ideas/newmont-nyse-nem-shows-what-scale-buys-in-gold-mining" target="_blank" rel="noopener noreferrer nofollow">.</a></p><p><strong>Barrick Mining Corporation (NYSE: B) (TSX: ABX)</strong>, formerly Barrick Gold, is the second-largest senior producer by attributable gold output and the operator of the Nevada Gold Mines joint venture with Newmont — the largest gold-producing complex in the world.</p><p><strong>Agnico Eagle Mines (NYSE: AEM) (TSX: AEM)</strong> is a Canadian senior with operations concentrated in lower-risk jurisdictions (Canada, Finland, Mexico, Australia). Agnico Eagle is frequently cited as the senior with the strongest jurisdictional mix in the tier.</p><p><strong>AngloGold Ashanti (NYSE: AU)</strong> operates across Africa, Australia, and the Americas, with material exposure to higher-risk African jurisdictions offset by diversification.</p><p><strong>Gold Fields (NYSE: GFI)</strong> is a South African-headquartered senior with operations in Australia, South America, Africa, and Canada. Its asset mix and cost position vary significantly by region.</p><p><strong>Kinross Gold (NYSE: KGC)</strong> sits at the boundary between the senior and mid-tier categories. Some classifications include it as a senior, others as the largest mid-tier producer.</p><p>This list is not exhaustive, and inclusion is not an endorsement. Several large state-owned Chinese and Russian gold producers (Zijin Mining, Polyus) are larger by output but trade on exchanges with limited accessibility to most international investors.</p><h2 id="where-the-tier-has-limits"><a href="#where-the-tier-has-limits">#</a>Where the Tier Has Limits</h2><p>Senior gold producers offer the cleanest equity exposure to gold, but they are not without structural disadvantages.</p><p><strong>Growth is mathematically constrained.</strong> Replacing 5 million ounces of annual production through exploration alone is extraordinarily difficult. The senior tier tends to grow through acquisition, and a buoyant gold market is precisely when the worst deals get done. </p><p><strong>Reserve Replacement.</strong> Even the strongest senior producers face a constant reserve replacement challenge. Large-scale gold mining depletes ore bodies over time, which means today’s low-cost producer can become tomorrow’s acquisition-driven consolidator if new reserves are not added efficiently.</p><p><strong>Operational leverage is muted.</strong> Low unit costs mean a rising gold price flows less aggressively into earnings expansion than at the mid-tier level. Investors looking for high beta to the gold price are usually better served further down the cap structure.</p><p><strong>Index ownership distorts price action.</strong> Senior gold producers are heavily held by gold mining ETFs and index funds, which means their share prices can move on flows rather than fundamentals. This is less true at the mid-tier and junior levels.</p><p><strong>Dividend yield is real but capped.</strong> Senior dividend yields rarely exceed 2 to 3% even at high gold prices, because management balances capital returns against growth capital and balance sheet preservation. Income investors looking specifically for yield from gold exposure often look at royalty and streaming companies instead, which we cover in our <a href="https://www.valuethemarkets.com/analysis/investing-ideas/gold-royalty-and-streaming-and-the-asset-light-model">Gold Royalty and Streaming Companies article</a>.</p><h2 id="the-bottom-line-on-the-senior-tier"><a href="#the-bottom-line-on-the-senior-tier">#</a>The Bottom Line on the Senior Tier</h2><p>The senior tier is the foundation of any gold equities portfolio. It offers low-cost production, geographic and operational diversification, capital return capacity, and cycle resilience that no other tier can match. The trade-off is muted operational leverage and structural growth constraints.</p><p>Investors prioritizing stability, diversification, and balance sheet strength will usually begin with the senior tier. Those seeking greater operational leverage and higher upside potential typically move toward mid-tier producers, junior miners, and <a href="https://www.valuethemarkets.com/analysis/investing-ideas/gold-explorers-and-developers">explorers</a>, where both risk and return profiles become more extreme.</p><p>For readers new to the mechanics of how gold companies actually generate margin, our <a href="https://www.valuethemarkets.com/analysis/market-reports-guides/guides/guide-to-investing-in-gold-mining" rel="noopener noreferrer nofollow"><strong>guide to investing in gold mining</strong></a> covers the operational fundamentals in detail.</p>
                ]]>
            </content>
                                                <category term="Investing Ideas" />
            
            <published>2026-05-12T07:11:11+00:00</published>
            <updated>2026-05-12T09:07:16+00:00</updated>
        </entry>
            <entry>
            <title><![CDATA[Jurisdiction-Focused Gold Stocks and Why Geography Matters]]></title>
            <link rel="alternate" href="https://www.valuethemarkets.com/analysis/investing-ideas/jurisdiction-focused-gold-stocks-and-why-geography-matters" />
            <id>https://www.valuethemarkets.com/28559</id>
            <author>
                <name><![CDATA[Patricia Miller]]></name>
                        <email><![CDATA[patricia.miller@digitonic.co.uk]]></email>
                    </author>
            <summary type="html">
                <![CDATA[Jurisdiction shapes gold mining stock returns more than most investors realise. A framework for understanding how geography affects every gold equity.]]>
            </summary>
                        <content type="html">
                <![CDATA[
                                        <p><a href="https://www.valuethemarkets.com/analysis/investing-ideas/jurisdiction-focused-gold-stocks-and-why-geography-matters"><img alt="Jurisdiction-Focused Gold Stocks and Why Geography Matters" src="https://www.valuethemarkets.com/curator/c0f43948-6d8f-4340-9652-a71bc3f0cc2e.png?fm=webp&amp;q=80&amp;s=d36d581987e50efb003067de7b304a48" /></a></p>
                                        <h2 id="how-geography-shapes-gold-equity-returns"><a href="#how-geography-shapes-gold-equity-returns">#</a>How Geography Shapes Gold Equity Returns</h2><p>Two gold mining companies with identical reserves, identical grades, and identical processing methods can deliver radically different shareholder returns based purely on where their mines are located. Permit timelines, royalty regimes, tax stability, infrastructure quality, and political risk all flow directly into project economics and, ultimately, into the discount rates the market applies to a stock (higher discount rates reduce the present value investors assign to future mine cash flows). Geography is not a secondary risk factor. For many gold mining stocks, it is the primary determinant of whether the investment case works.</p><p>This article is part of the <a href="https://www.valuethemarkets.com/analysis/investing-ideas/gold-stocks-to-buy-a-framework-for-gold-equities"><strong><u>Gold Stocks to Buy</u></strong></a> series and looks at jurisdiction as a category of analysis. It does not recommend any individual stock or country. It explains how geography affects gold equity returns across every tier covered in earlier articles, which jurisdictions consistently attract mining capital, and how investors can use jurisdictional analysis to refine their allocation across any gold stocks list.</p><h2 id="why-jurisdiction-matters-more-than-most-investors-realise"><a href="#why-jurisdiction-matters-more-than-most-investors-realise">#</a>Why Jurisdiction Matters More Than Most Investors Realise</h2><p>Mining executives surveyed annually by the Fraser Institute consistently report that policy factors influence around 40% of their investment decisions, with the remainder driven by geological potential and economics. The 2025 Annual Survey of Mining Companies, published in <a href="https://www.fraserinstitute.org/studies/annual-survey-mining-companies-2025"><u>February 2026</u></a>, ranked 68 jurisdictions globally on a combined policy and mineral potential index. Nevada took the top position globally, followed by Ontario and Saskatchewan, with the rest of the top ten including South Australia, Arizona, Western Australia, Botswana, Norway, Sweden, and Saudi Arabia.</p><p>These rankings affect how mining capital is allocated globally. Gold companies operating in highly ranked jurisdictions consistently command valuation premiums over those operating in lower-ranked ones. Junior gold producers with single mines in Tier-1 jurisdictions trade at higher multiples than otherwise comparable juniors in higher-risk countries. Senior producers actively pay up to acquire reserves in stable jurisdictions, recognising that the discount rates applied to their cash flows are lower in low-risk geographies.</p><p>The Fraser Institute survey is one input rather than a definitive scorecard, and academic analysis has noted methodological concerns including survey response rates and respondent bias. However, the broader principle, that mining capital flows to where policy is predictable, is supported by a wide body of investment behaviour that does not depend on any single ranking.</p><h2 id="what-jurisdiction-actually-influences"><a href="#what-jurisdiction-actually-influences">#</a>What Jurisdiction Actually Influences</h2><p>The factors that make a jurisdiction attractive or unattractive for gold mining are concrete and measurable, even if the resulting investment decisions are partly subjective.</p><p><strong>Permitting timelines and predictability.</strong> A gold project in Nevada that takes three years to permit competes for capital against one in a slower-moving jurisdiction that takes ten or fifteen. (Permitting is the regulatory approval process required before a mine can be built, covering environmental impact assessments, water use rights, land access, and consultation requirements.) Time is capital, and longer timelines compound the cost of capital across the full project life.</p><p><strong>Royalty and tax regimes.</strong> Fiscal terms vary widely by jurisdiction and are not always stable. Changes to royalty rates, taxation, or state participation can materially impair project economics, and several mining jurisdictions have unilaterally tightened fiscal terms in recent years. Resource nationalism tends to intensify during commodity bull markets, when governments seek a larger share of mining profits through royalties, taxes, or state participation.</p><p><strong>Political stability.</strong> Stable democracies with consistent legal frameworks reduce the risk of expropriation, contract disputes, or sudden regulatory reversals. Less stable jurisdictions carry premium discount rates regardless of geological quality.</p><p><strong>Infrastructure access.</strong> Roads, power grids, water access, ports, and skilled labour all materially affect project capital costs. A high-grade deposit in remote Yukon faces different infrastructure economics than a comparable deposit near established Nevada mining infrastructure, even though both sit in stable jurisdictions.</p><p><strong>Indigenous and community relations frameworks.</strong> In Canada and Australia particularly, the relationship between mining companies and Indigenous communities is structurally embedded in the permitting process. Jurisdictions with clear, predictable frameworks for these relationships tend to deliver more reliable project timelines than those without. Institutional capital increasingly treats ESG performance and jurisdictional quality as linked variables rather than separate considerations.</p><p><strong>Currency stability.</strong> Gold is priced in US dollars, but mining costs are often denominated in local currencies. Jurisdictions with volatile or controlled currencies introduce additional risk to operating margins that do not exist in countries with stable, freely traded currencies.</p><h2 id="how-jurisdiction-shapes-gold-stocks"><a href="#how-jurisdiction-shapes-gold-stocks">#</a>How Jurisdiction Shapes Gold Stocks</h2><p>Geography interacts with company size and business model in ways that matter for portfolio construction.</p><p><a href="https://www.valuethemarkets.com/analysis/investing-ideas/senior-gold-producers"><strong><u>Senior gold producers</u></strong></a> are typically diversified across multiple jurisdictions, which dampens but does not eliminate geographic risk. However, even diversified seniors carry weighted-average jurisdictional risk, and that weighted average affects valuation. A senior with 60% of production in Tier-1 jurisdictions trades at a different multiple than one with 60% in higher-risk geographies.</p><p><a href="https://www.valuethemarkets.com/analysis/investing-ideas/mid-tier-gold-miners-what-to-know-about-the-growth-tier"><strong><u>Mid-tier gold miners</u></strong></a> typically concentrate in two or three jurisdictions. The concentration means jurisdictional choice determines a much larger share of the investment thesis than at the senior level. Mid-tiers with growth pipelines in stable jurisdictions tend to fund themselves more cheaply and execute more reliably than those concentrated in higher-risk geographies.</p><p><a href="https://www.valuethemarkets.com/analysis/investing-ideas/junior-gold-producers"><strong>Junior gold producers</strong></a> carry the sharpest jurisdictional exposure. With one or two mines, the jurisdiction is effectively the entire investment case. Tier-1 juniors command structural premiums that are very difficult to overcome through operational excellence in lower-tier jurisdictions.</p><p><a href="https://www.valuethemarkets.com/analysis/investing-ideas/gold-royalty-and-streaming-and-the-asset-light-model"><strong>Royalty and streaming companies</strong></a> moderate jurisdictional risk through diversification across hundreds of underlying assets, but the highest-quality royalty companies still actively prefer Tier-1 jurisdictions. The premium royalty companies pay for stable-jurisdiction royalties reflects market consensus on the discount rate differential.</p><p><a href="https://www.valuethemarkets.com/analysis/investing-ideas/gold-explorers-and-developers"><strong>Explorers and developers</strong></a> face the most acute jurisdictional risk because permitting outcomes determine whether a project ever becomes a mine. A discovery in a Tier-1 jurisdiction is fundamentally more valuable than an identical discovery in an unstable one, because the probability of converting it into production is higher.</p><h2 id="tier-1-jurisdictions-and-what-they-deliver"><a href="#tier-1-jurisdictions-and-what-they-deliver">#</a>Tier-1 Jurisdictions and What They Deliver</h2><p>A small number of jurisdictions consistently attract the bulk of global gold mining capital. These are typically referred to as Tier-1 or top-quartile jurisdictions, though the terminology is informal.</p><p><strong>Nevada</strong> is often cited as the most consistently attractive mining jurisdiction globally, anchored by predictable permitting, stable tax structures, established infrastructure, and significant existing gold production. Most senior, mid-tier, and junior producers active in the United States have material Nevada exposure. The Carlin and Cortez trends together host some of the largest gold mining complexes in the world, including the Nevada Gold Mines joint venture between Newmont and Barrick.</p><p><strong>Ontario</strong> has emerged as one of Canada&#039;s strongest mining jurisdictions, particularly after recent provincial government measures to reduce mine approval times. The Abitibi greenstone belt extending across northeastern Ontario and northwestern Quebec is one of the most prolific gold-producing regions globally. Companies with major Ontario gold exposure include Agnico Eagle, Alamos Gold (Island Gold), and First Mining Gold (Springpole).</p><p><strong>Saskatchewan</strong> ranks consistently among the top global jurisdictions, primarily on uranium strength but with growing gold exposure. Its policy framework is widely seen as predictable and pro-mining.</p><p><strong>Quebec</strong> historically ranked highly but has seen some policy concerns flagged in recent surveys. It remains a significant gold producing region with major operators present.</p><p><strong>Australia (Western Australia, South Australia, Queensland)</strong> offers world-class geology combined with stable institutions, established mining law, and strong infrastructure. Major Australian gold producers include Northern Star Resources, Evolution Mining, and Newmont&#039;s Australian operations (Boddington, Tanami, Cadia).</p><p><strong>Finland and Sweden</strong> have historically scored very highly on Fraser Institute rankings due to strong policy frameworks, though their gold mining footprints are smaller than the major mining countries.</p><p><strong>Botswana</strong> is consistently the highest-ranked African mining jurisdiction, supported by stable democratic institutions and predictable mining law.</p><h2 id="higher-risk-jurisdictions-and-the-trade-off"><a href="#higher-risk-jurisdictions-and-the-trade-off">#</a>Higher-Risk Jurisdictions and the Trade-Off</h2><p>Some jurisdictions carry meaningful policy or political risk but offer geological potential strong enough to attract capital regardless. The trade-off varies, and so do the outcomes.</p><p><strong>West Africa (Mali, Burkina Faso, Côte d&#039;Ivoire, Senegal)</strong> has been a major focus of mid-tier and junior gold investment due to high-grade discoveries and lower exploration costs. However, the region has also seen multiple high-profile incidents in recent years involving royalty disputes, military coups, asset seizures, and changes to mining codes. Endeavour Mining, B2Gold, and several other producers have material exposure.</p><p><strong>Latin America (Mexico, Peru, Argentina, Chile, Brazil, Colombia)</strong> offers significant geological potential across a range of policy environments. Mexico has favourable existing operations but has seen increasing policy concerns, particularly around new mining laws restricting open-pit operations and fees increases. Argentina&#039;s mining-friendly provinces have attracted significant investment but currency controls have historically been a concern. Chile and Peru remain heavily mined but have faced periodic policy shifts.</p><p><strong>Turkey</strong> has been the focus of significant gold and copper investment, anchored by Eldorado Gold&#039;s operations and other producers. Permitting and operating risks are real but have generally been managed through long-running relationships.</p><p><strong>Papua New Guinea</strong> hosts world-class deposits including Newmont&#039;s Lihir mine, but jurisdictional and operational risks have historically been higher than in Tier-1 countries.</p><p><strong>Tanzania, Ghana, and other African jurisdictions</strong> present a mix of operational opportunity and policy risk, with significant variation by specific country and sometimes by specific government.</p><p><strong>China and Russia</strong> host substantial gold production but are largely inaccessible to international equity investors due to listing restrictions, sanctions, or other barriers.</p><h2 id="what-to-look-for-when-evaluating-jurisdictional-exposure"><a href="#what-to-look-for-when-evaluating-jurisdictional-exposure">#</a>What to Look For When Evaluating Jurisdictional Exposure</h2><p>The framework introduced in the <strong>Gold Stocks to Buy</strong> series applies to jurisdictional analysis with several specific emphasis points.</p><p><strong>Diversification across jurisdictions.</strong> A senior or mid-tier producer with operations across several stable jurisdictions carries materially less geographic risk than one concentrated in a single country, even if both nominally operate in the same risk tier.</p><p><strong>Concentration of growth pipeline.</strong> Current production is one variable; future production from growth projects is another. A producer whose current mines are diversified but whose growth pipeline is concentrated in a single, riskier jurisdiction carries a forward-looking concentration risk that current production data does not reveal.</p><p><strong>History of jurisdiction stability versus recent change.</strong> Some jurisdictions have decades of stable mining policy. Others have stable policy at present but recent changes that have not yet been tested. Analysis should weight long-term stability against the possibility that recent reforms reverse.</p><p><strong>Operator track record in the jurisdiction.</strong> Some companies have decades of operating experience in a particular country, building relationships and institutional knowledge that newer entrants lack. This experience can materially reduce execution risk and is often underpriced.</p><p><strong>Currency exposure.</strong> Gold revenue is dollar-denominated; costs may be local-currency-denominated. The interaction creates either tailwinds or headwinds depending on currency direction. This effect is more pronounced in higher-risk jurisdictions where currencies tend to be more volatile.</p><p><strong>ESG and community relations standing.</strong> Companies with strong relationships with local communities and indigenous groups face fewer permitting delays, fewer protests, and lower operating disruption. These relationships are difficult to assess from financial reports alone but are visible in operational track records over time.</p><h2 id="where-jurisdictional-analysis-has-limits"><a href="#where-jurisdictional-analysis-has-limits">#</a>Where Jurisdictional Analysis Has Limits</h2><p>Treating jurisdiction as the primary lens for gold equity selection has structural limits.</p><p><strong>Tier-1 jurisdictions command premium valuations.</strong> The same factors that make Nevada or Ontario attractive also mean their gold companies trade at premium multiples. In sustained gold bull markets, the underperformance of higher-risk jurisdictions can compress as investors reach for higher-beta exposure.</p><p><strong>Country risk is not constant.</strong> A Tier-1 jurisdiction can deteriorate, and a higher-risk one can improve. British Columbia, for example, dropped seven ranks in the most recent Fraser Institute survey on concerns about land claims and protected areas. Nova Scotia improved dramatically in the same period due to policy changes. Static jurisdictional analysis misses these dynamics.</p><p><strong>Geological quality can offset jurisdiction.</strong> A truly world-class deposit in a moderate-risk jurisdiction may deliver better returns than a marginal deposit in a Tier-1 jurisdiction. Jurisdictional analysis should not override fundamental asset quality assessment.</p><p><strong>Diversification through producers vs ETFs.</strong> Investors seeking jurisdictional diversification have multiple routes: holding diversified senior producers, holding royalty and streaming companies, or holding gold mining ETFs that span the global universe. Each approach delivers different jurisdictional balances.</p><p><strong>Surveys reflect perception, not pure fact.</strong> Rankings such as the Fraser Institute survey reflect mining executive perceptions, which can lag actual conditions or be influenced by individual experiences. Investors should treat rankings as one input among many, not as definitive guides.</p><h2 id="the-bottom-line-on-jurisdiction"><a href="#the-bottom-line-on-jurisdiction">#</a>The Bottom Line on Jurisdiction</h2><p>Geography shapes gold mining stock returns more than most investors recognise. The same operational excellence applied in different jurisdictions produces materially different shareholder outcomes, and the gap between Tier-1 and higher-risk jurisdictions has been persistent across cycles.</p><p>For investors building gold equity exposure, jurisdiction is a useful primary filter. Starting with companies operating in stable jurisdictions, then layering on size, stage, and business model considerations, tends to produce a more resilient portfolio than the reverse approach of selecting on operational characteristics first and accepting the resulting jurisdictional mix.</p><p>Higher-risk jurisdictions can deliver outsized returns when policy stability holds and geology delivers, but the dispersion of outcomes is wider. Investors comfortable with that variance can hold targeted positions in higher-risk-jurisdiction names, but should size them accordingly and recognise that even the strongest operators cannot fully hedge country risk.</p><p>This article completes the Gold Stocks to Buy series. Across the six articles, the framework has moved from senior producers through mid-tiers, junior producers, royalty and streaming companies, explorers and developers, and finally jurisdictional analysis. Each tier offers different exposures to a rising gold price, and each carries different risks. The most resilient gold equity portfolios typically combine exposures across multiple tiers, weighted toward the investor&#039;s specific tolerance for risk and timeframe for returns.</p><p>For readers new to the mechanics of how gold companies actually generate margin, our <a href="https://www.valuethemarkets.com/analysis/market-reports-guides/guides/guide-to-investing-in-gold-mining"><strong><u>guide to investing in gold mining</u></strong></a> covers the operational fundamentals in detail.</p>
                ]]>
            </content>
                                                <category term="Investing Ideas" />
            
            <published>2026-05-12T09:01:32+00:00</published>
            <updated>2026-05-12T09:14:31+00:00</updated>
        </entry>
            <entry>
            <title><![CDATA[Gold Explorers and Developers and the Discovery Trade]]></title>
            <link rel="alternate" href="https://www.valuethemarkets.com/analysis/investing-ideas/gold-explorers-and-developers" />
            <id>https://www.valuethemarkets.com/28552</id>
            <author>
                <name><![CDATA[]]></name>
                    </author>
            <summary type="html">
                <![CDATA[Gold explorers and developers offer the sharpest exposure to discovery and permitting outcomes. A framework for the highest-risk tier in gold equities.]]>
            </summary>
                        <content type="html">
                <![CDATA[
                                        <p><a href="https://www.valuethemarkets.com/analysis/investing-ideas/gold-explorers-and-developers"><img alt="Gold Explorers and Developers and the Discovery Trade" src="https://www.valuethemarkets.com/curator/f9c906c0-4b27-46ef-b089-a7f3ac2afab8.png?fm=webp&amp;q=80&amp;s=507cee72f336c3c667793e8852181c6a" /></a></p>
                                        <h2 id="what-pre-revenue-gold-companies-actually-are"><a href="#what-pre-revenue-gold-companies-actually-are">#</a>What Pre-Revenue Gold Companies Actually Are</h2><p>Gold explorers and developers do not produce gold. They search for it, prove it up through drilling and engineering work, and try to advance projects toward eventual production. The tier covers everything from grassroots exploration companies looking for a deposit, to advanced developers with feasibility studies and permits in hand, working toward construction. What unites them is the absence of revenue from gold sales — these are companies funded entirely by raising capital, with the investment case resting on what their projects might one day become.</p><p>This article is part of the <a href="https://www.valuethemarkets.com/analysis/investing-ideas/gold-stocks-to-buy-a-framework-for-gold-equities"><strong><u>Gold Stocks to Buy</u></strong></a> series and looks at the explorer and developer tier as a category. It does not recommend any individual stock. It explains where these companies sit in the gold equity universe, the stages they move through, what the tier offers investors, and why the dispersion of outcomes is wider here than anywhere else on a gold stocks list.</p><h2 id="how-the-tier-is-actually-structured"><a href="#how-the-tier-is-actually-structured">#</a>How the Tier Is Actually Structured</h2><p>The explorer and developer tier is not one category but a spectrum. Companies move through distinct stages, each with different risk profiles and different valuation drivers. Understanding the stages is the first step to understanding the tier.</p><p><strong>Grassroots explorers</strong> are at the earliest stage. They hold land packages they believe are prospective for gold mineralisation, typically based on geology, historical work, or proximity to known deposits. They drill holes hoping to make a discovery.</p><p><strong>Resource-stage explorers</strong> have made enough discoveries to define a measured, indicated, or inferred mineral resource. (A mineral resource is a quantity of gold demonstrated to exist in the ground at a defined grade, but not yet shown to be economically mineable. Mineral reserves, by contrast, are the subset of resources that have been shown to be economically extractable through engineering studies.) The investment case shifts from &#34;will they find gold&#34; to &#34;will they expand the resource and prove it economic.&#34;</p><p><strong>PEA-stage developers</strong> have completed a Preliminary Economic Assessment — a study that estimates project economics using mineral resources, including inferred resources too uncertain to be classified as reserves. (A PEA is a conceptual study of project viability, and Canadian regulators require disclaimers on every PEA stating that there is no certainty the projected economics will be realised.) PEAs typically show the project working at assumed gold prices, but they do not constitute proof that a mine will be built.</p><p><strong>PFS and feasibility-stage developers</strong> have completed Pre-Feasibility Studies or Feasibility Studies, the more rigorous engineering work required to define a mineral reserve and demonstrate that a mine can be built and operated economically. These companies typically have permits underway or in hand and are working toward a construction decision.</p><p><strong>Construction-ready developers</strong> have completed feasibility, secured permits, <a href="https://www.valuethemarkets.com/analysis/investing-ideas/gold-royalty-and-streaming-and-the-asset-light-model">arranged financing</a>, and are either preparing to build or actively building. The investment case is dominated by execution risk on construction and ramp-up.</p><p>Each stage carries different risks and different potential rewards. Conflating an early-stage explorer with a construction-ready developer is one of the most common analytical mistakes investors make in the tier.</p><h2 id="what-the-tier-offers-investors"><a href="#what-the-tier-offers-investors">#</a>What the Tier Offers Investors</h2><p><strong>Some of the highest sensitivity to gold price moves in the listed gold universe.</strong> Pre-revenue gold companies are even more sensitive to gold prices than <a href="https://www.valuethemarkets.com/analysis/investing-ideas/junior-gold-producers">producing juniors</a>. In a strong gold market, a developer with a feasibility study showing 30% project IRR at a $2,500 gold price is suddenly showing 70% IRR at $4,500. The stock can move several multiples on the same operating plan. This sensitivity is what makes the tier attractive in rising markets and brutal in falling ones.</p><p><strong>Discovery upside.</strong> A genuine new discovery can transform a company&#039;s market value by 10x or more in a matter of weeks. (Discovery upside means the share price increase that follows finding a new deposit large enough to justify a mine.) The dispersion between successful explorers and unsuccessful ones is enormous, and a small position in a successful explorer can dwarf the gains from a much larger position in a <a href="https://www.valuethemarkets.com/analysis/investing-ideas/senior-gold-producers"><u>senior producer</u></a>.</p><p><strong>Acquisition premium potential.</strong> Senior and <a href="https://www.valuethemarkets.com/analysis/investing-ideas/mid-tier-gold-miners-what-to-know-about-the-growth-tier"><u>mid-tier producers</u></a> buy developers to add reserves. Acquisition premiums of 30% to 60% over the trading price are common when a developer reaches construction-ready status with <a href="https://www.valuethemarkets.com/analysis/investing-ideas/jurisdiction-focused-gold-stocks-and-why-geography-matters">a quality asset in a stable jurisdiction</a>. The exit can come at any stage, and the timing is not under shareholder control.</p><p><strong>Optionality on the gold price.</strong> Many explorers hold projects that are uneconomic at low gold prices but transformative at high ones. These projects represent free options on a higher gold price — they cost the company holding capital to maintain, but the shareholder pays nothing extra to own the upside. In sustained gold bull markets, previously dormant projects can become valuable simply because the metal price changed.</p><h2 id="what-to-look-for-when-evaluating-explorers-and-developers"><a href="#what-to-look-for-when-evaluating-explorers-and-developers">#</a>What to Look For When Evaluating Explorers and Developers</h2><p>The framework introduced in the <a href="https://www.valuethemarkets.com/analysis/investing-ideas/gold-stocks-to-buy-a-framework-for-gold-equities"><strong><u>Gold Stocks to Buy</u></strong></a> series tightens significantly here, because there are no operating mines, no production figures, and no AISC to evaluate. The judgment is almost entirely about the quality of the asset, the credibility of the work, and the capacity to fund the next stage.</p><p><strong>Stage of advancement.</strong> A grassroots explorer and a feasibility-stage developer are fundamentally different investments, even if both trade at similar market caps. Match the stage to the investor&#039;s risk tolerance and timeframe. Grassroots exploration is binary and long-dated. Construction-ready development is more predictable but requires capital scale to fund.</p><p><strong>Quality of the resource or reserve.</strong> Grade, tonnage, depth, metallurgy, and strip ratio matter enormously. (Metallurgy here describes how easily gold can be recovered from the ore — some deposits release gold cheaply through standard processing, others require complex and expensive treatment.) A 1.5 g/t open-pit deposit with simple metallurgy is a fundamentally different asset than a 3 g/t deposit with refractory ore that needs autoclaving.</p><p><strong>Jurisdiction.</strong> Permitting risk is concentrated in this tier. A project in Tier-1 Canada or the Western US is on a different permitting timeline and carries different counterparty risk than a project in a jurisdiction with unstable regulatory frameworks. Investors should understand exactly where a project sits and what the realistic permitting timeline looks like.</p><p><strong>Funding runway.</strong> Pre-revenue companies must raise capital periodically. Look at cash on hand, planned spending, and how many months of work the current treasury supports. A company with six months of runway approaching a major catalyst is in a much stronger negotiating position than one with two months of runway and financing already on the agenda.</p><p><strong>Management track record.</strong> Has the team taken previous projects to production, or to successful sale? Discovery and development are heavily dependent on individual judgment and experience. The strongest exploration and development companies are typically built around technical teams with prior successes in similar geological and jurisdictional contexts.</p><p><strong>Catalyst calendar.</strong> Pre-revenue companies are valued largely on what they might disclose next — drill results, resource updates, PEA or feasibility outputs, permit milestones, financing announcements. A clear catalyst calendar over the coming 12 to 24 months matters because it is what the market will be re-pricing the stock against.</p><p><strong>Share structure and ownership.</strong> Exploration and development companies often have complex capital structures with warrants, options, and tranches of equity issued at different prices. Look at fully diluted share counts, insider ownership, and whether key shareholders have supported recent financings. Heavy management and institutional ownership is generally a positive signal.</p><h2 id="which-companies-sit-in-the-tier"><a href="#which-companies-sit-in-the-tier">#</a>Which Companies Sit in the Tier</h2><p>The explorer and developer tier is the largest and most varied segment in the gold equity universe, with hundreds of companies listed across the TSX, TSX Venture, ASX, AIM, and other junior exchanges.</p><p>Investors screening this tier should focus on four live buckets, discovery explorers, resource-stage explorers, economic developers, and construction-ready developers, then screen for zero revenue, strong treasury positions, Tier-1 jurisdiction exposure, and clearly identifiable 12-month catalysts.</p><p>The composition of this tier shifts constantly as companies advance through development stages, are acquired, or fail to progress. Investors evaluating the category should look beyond named examples and focus instead on companies actively reporting against credible catalyst calendars.</p><h2 id="where-the-tier-has-limits"><a href="#where-the-tier-has-limits">#</a>Where the Tier Has Limits</h2><p>The explorer and developer tier carries structural disadvantages that no operational excellence can offset.</p><p><strong>Many exploration projects fail.</strong> Only a tiny fraction ever become producing mines, with industry and government <a href="https://www.ourcommons.ca/Content/Committee/432/RNNR/Reports/RP11412677/rnnrrp06/rnnrrp06-e.pdf"><u>estimates</u></a> suggesting the odds of an early-stage prospect ultimately becoming a mine are exceptionally low. Most exploration programs fail not because management is incompetent, but because economically viable gold discoveries are genuinely rare.</p><p><strong>Permitting timelines can extend a decade or more.</strong> Even quality projects in stable jurisdictions often take well over a decade to move from discovery to production, with S&amp;P Global <a href="https://www.spglobal.com/market-intelligence/en/news-insights/research/discovery-to-production-averages-15-7-years-for-127-mines"><u>estimating</u></a> average mine lead times at roughly 15 years. Pre-revenue companies must fund themselves continuously through that period, which means persistent equity issuance and dilution for shareholders who entered early.</p><p><strong>Single-asset risk is absolute.</strong> A junior explorer with one project has 100% of its value tied to that project. A geological surprise, a permitting setback, or a community opposition campaign can wipe out the investment thesis with no diversification to absorb the impact.</p><p><strong>Funding risk is constant.</strong> Pre-revenue companies depend entirely on capital markets. In strong gold markets, financings are readily available. Exploration financing conditions can change abruptly with broader equity markets, even when underlying gold prices remain strong. In weak markets, even quality projects struggle to fund continued work, which can force project sales at distressed valuations or extended periods of inactivity.</p><p><strong>Information asymmetry is high.</strong> Drill results, resource estimates, and economic studies require technical expertise to interpret correctly. Press releases tend to emphasise positive aspects, and investors without geological or engineering backgrounds may struggle to distinguish genuinely strong technical reports from marginal ones dressed up in promotional language.</p><p><strong>Liquidity is often poor.</strong> Many explorers and developers trade thinly. Bid-ask spreads can be wide, particularly during quiet periods between catalysts, and large positions may be difficult to exit at screen prices.</p><h2 id="the-bottom-line-on-explorers-and-developers"><a href="#the-bottom-line-on-explorers-and-developers">#</a>The Bottom Line on Explorers and Developers</h2><p>Gold explorers and developers offer the highest-variance outcomes in the gold equity universe. The successful names in the tier can deliver returns no other category can match. The unsuccessful ones, which constitute the majority, typically destroy capital regardless of the gold price.</p><p>For investors with the technical capacity to evaluate exploration and development projects, or the discipline to size positions appropriately and accept binary outcomes, the tier offers genuine optionality. For investors building gold equity exposure for income, predictability, or steady appreciation, the explorer and developer tier should typically be a small part of the portfolio rather than the foundation.</p><p>The next article in <strong>this series</strong> moves to jurisdiction-focused gold stocks, which examine how geography shapes returns across every tier of the gold equity universe.</p><p>For readers new to the mechanics of how gold companies actually generate margin, our <a href="https://www.valuethemarkets.com/analysis/market-reports-guides/guides/guide-to-investing-in-gold-mining"><strong><u>guide to investing in gold mining</u></strong></a> covers the operational fundamentals in detail.</p>
                ]]>
            </content>
                                                <category term="Investing Ideas" />
            
            <published>2026-05-12T08:40:55+00:00</published>
            <updated>2026-05-12T09:06:18+00:00</updated>
        </entry>
    </feed>