<?xml version="1.0" encoding="UTF-8"?>
<feed xmlns="http://www.w3.org/2005/Atom" xml:lang="en-US">
                        <id>https://www.valuethemarkets.com/feed/investing-data-story</id>
                                <link href="https://www.valuethemarkets.com/feed/investing-data-story" rel="self"></link>
            <link rel="hub" href="https://pubsubhubbub.appspot.com/" />
                                <title><![CDATA[Investing Data Stories]]></title>
                                <logo>https://www.valuethemarkets.com/images/logo-dark.png</logo>
                                <subtitle>Transforming complex markets and industries into simple, visual insights that investors can act on.</subtitle>
                                                    <updated>2026-07-14T08:34:14+00:00</updated>
                        <entry>
            <title><![CDATA[The New Geography of Natural Gas]]></title>
            <link rel="alternate" href="https://www.valuethemarkets.com/investing-data-story/the-new-geography-of-natural-gas" />
            <id>https://www.valuethemarkets.com/41522</id>
            <author>
                <name><![CDATA[Kirsteen Mackay]]></name>
                        <email><![CDATA[kirsteen.mackay@digitonic.co.uk]]></email>
                    </author>
            <summary type="html">
                <![CDATA[The regions that consume the most gas are not the ones producing it, and the geopolitical fractures of recent years have made that imbalance harder to manage.]]>
            </summary>
                        <content type="html">
                <![CDATA[
                                        <p><a href="https://www.valuethemarkets.com/investing-data-story/the-new-geography-of-natural-gas"><img alt="The New Geography of Natural Gas" src="https://www.valuethemarkets.com/curator/media/1d9580c7-40a0-4d44-b3ce-04f985e57c21.jpg?fm=webp&amp;q=80&amp;s=2767d385450831705450f09ca2415d14" /></a></p>
                                        <div>
                <figure class>
                            <img src="/curator/media/46191965-2c7e-41bb-a983-2c0f0aa14ecc.jpg?fm&#61;webp&amp;q&#61;80&amp;s&#61;1f3d4e02c67b19a888ca9e13298f1647" alt="World Gas Supply and Demand" width="1200" height="1500" />
                                        </figure>
    </div>
<p><strong>Sponsored by: CanCambria Energy. </strong>European gas supply remains constrained, with pricing consistently above North American benchmarks. CanCambria is targeting this gap with a large-scale tight gas project in southern Hungary. <a href="https://www.valuethemarkets.com/analysis/market-reports-guides/reports/cancambria-energy-unlocking-europes-gas-gap?utm_source&#61;website&amp;utm_medium&#61;ids3&amp;utm_campaign&#61;cc001&amp;utm_content&#61;top"><strong><u>Access our Exclusive Investor Report on CanCambria Energy</u></strong></a>.</p><p>For most of the twentieth century, the geography of natural gas was relatively predictable. The countries that sat on the largest reserves, such as Russia, Iran, and Qatar, held structural leverage over the countries that needed the fuel to run their economies, and pipelines were built to reflect that dependency.</p><p>That geography is being redrawn. Russia&#039;s invasion of Ukraine, a decade of underinvestment in European domestic production, and the rapid scaling of North American LNG export capacity have produced a global gas market that looks fundamentally different from the one that existed just a few years ago. The data below sets out who produced and consumed gas in 2024<sup>1</sup>, alongside 2025 production estimates<sup>2</sup>, and the regional balances that result. Which routes can move that surplus gas to regions that need it is now a central question in global energy policy.</p><h2 id="natural-gas-production-and-consumption-by-region"><a href="#natural-gas-production-and-consumption-by-region">#</a>Natural gas production and consumption by region</h2><p>All figures in bcm.</p><table><tbody><tr><td rowspan="1" colspan="1"><p><strong>Region</strong></p></td><td rowspan="1" colspan="1"><p><strong>Production 2024</strong></p></td><td rowspan="1" colspan="1"><p><strong>Production 2025 (est.)</strong></p></td><td rowspan="1" colspan="1"><p><strong>Consumption 2024</strong></p></td><td rowspan="1" colspan="1"><p><strong>2024 balance</strong></p></td></tr><tr><td rowspan="1" colspan="1"><p>North America</p></td><td rowspan="1" colspan="1"><p>1,263</p></td><td rowspan="1" colspan="1"><p>1,362</p></td><td rowspan="1" colspan="1"><p>1,131</p></td><td rowspan="1" colspan="1"><p>&#43;132 surplus</p></td></tr><tr><td rowspan="1" colspan="1"><p>Middle East &amp; Africa</p></td><td rowspan="1" colspan="1"><p>978</p></td><td rowspan="1" colspan="1"><p>997</p></td><td rowspan="1" colspan="1"><p>771</p></td><td rowspan="1" colspan="1"><p>&#43;208 surplus</p></td></tr><tr><td rowspan="1" colspan="1"><p>Asia Pacific</p></td><td rowspan="1" colspan="1"><p>708</p></td><td rowspan="1" colspan="1"><p>745</p></td><td rowspan="1" colspan="1"><p>973</p></td><td rowspan="1" colspan="1"><p>-265 deficit</p></td></tr><tr><td rowspan="1" colspan="1"><p>Russia &amp; CIS</p></td><td rowspan="1" colspan="1"><p>813</p></td><td rowspan="1" colspan="1"><p>843</p></td><td rowspan="1" colspan="1"><p>616</p></td><td rowspan="1" colspan="1"><p>&#43;197 surplus</p></td></tr><tr><td rowspan="1" colspan="1"><p>Europe</p></td><td rowspan="1" colspan="1"><p>198</p></td><td rowspan="1" colspan="1"><p>198</p></td><td rowspan="1" colspan="1"><p>469</p></td><td rowspan="1" colspan="1"><p>-271 deficit</p></td></tr><tr><td rowspan="1" colspan="1"><p>Latin America</p></td><td rowspan="1" colspan="1"><p>165</p></td><td rowspan="1" colspan="1"><p>197</p></td><td rowspan="1" colspan="1"><p>169</p></td><td rowspan="1" colspan="1"><p>-4 deficit</p></td></tr></tbody></table><p><strong>Sources:</strong> Energy Institute Statistical Review of World Energy 2025 (2024 data)<sup>1</sup>; OPEC Annual Statistical Bulletin 2026 (2025 estimates)<sup>2</sup>. Production excludes gas flared or recycled.</p><h2 id="five-things-investors-should-know"><a href="#five-things-investors-should-know">#</a>Five Things Investors Should Know</h2><ul><li><p>Europe runs the world&#039;s largest regional shortfall, producing around 198 bcm (billion cubic meters, the standard unit for gas volumes) in 2024 while consuming close to 469 bcm<sup>1</sup>. The 2025 estimates show European production flat, so the gap persists<sup>2</sup>.</p></li><li><p>The EU has committed to phasing out Russian LNG from January 2027 and Russian pipeline gas by autumn 2027<sup>3</sup>, which makes filling Europe&#039;s deficit more politically constrained and increasingly exposed to LNG market pricing.</p></li><li><p>Asia Pacific is the largest demand center in the world, consuming 973 bcm in 2024 against production of 708 bcm. Europe and Asia compete for the same pool of global LNG supply, so a cold winter or supply outage in one region bids up prices in both.</p></li><li><p>North America&#039;s surplus widened further in 2025 as US shale output expanded, and the infrastructure to move gas to European and Asian buyers already exists. Russia and CIS held a larger nominal surplus in 2024, but most of it has no viable route to premium-priced markets.</p></li><li><p>For investors, the significant point is that this geography is slow to reverse. Pipeline infrastructure takes decades to build and political relationships take years to rebuild, which makes the data a lens for judging which producing regions are structurally advantaged over a multi-year horizon rather than a short-term trade.</p></li></ul><h2 id="why-existing-surplus-regions-cannot-fill-the-gap-alone"><a href="#why-existing-surplus-regions-cannot-fill-the-gap-alone">#</a>Why Existing Surplus Regions Cannot Fill the Gap Alone</h2><p>LNG has absorbed much of the adjustment since 2022. US exports surged as new terminal capacity came online, and European buyers paid the premium required to pull cargoes away from competing Asian demand. But LNG depends on liquefaction at the export end, regasification at the import end, and a global supply pool large enough to service two major deficit regions simultaneously. Recent disruptions to Qatari LNG flows illustrated how quickly those conditions can fail to hold<sup>4</sup>.</p><p>The Middle East and Africa hold the second largest surplus in the data, yet converting it into deliverable supply requires LNG capacity that is capital-intensive, slow to permit, and concentrated in a small number of terminals.</p><p>That leaves North America, with growing output, private-sector discipline, and export infrastructure that already works, as the region with the clearest structural advantage among exporters. Yet every molecule of imported supply carries a cost floor set by liquefaction and shipping, which means the other structurally advantaged position belongs to producers operating inside the deficit region itself.</p><h2 id="producing-inside-the-deficit"><a href="#producing-inside-the-deficit">#</a>Producing Inside the Deficit</h2><p><a href="https://www.valuethemarkets.com/analysis/market-reports-guides/reports/cancambria-energy-unlocking-europes-gas-gap?utm_source&#61;website&amp;utm_medium&#61;ids3&amp;utm_campaign&#61;cc001&amp;utm_content&#61;mid"><strong><u>CanCambria Energy Corp</u></strong></a> (TSXV: CCEC) (OTCQB: CCEYF) (FSE: 4JH) is advancing its 100%-owned Kiskunhalas tight gas project in southern Hungary. The project is positioned in a European gas market where prices have historically exceeded those in North America, while domestic production meets only around 20% of Hungary&#039;s gas demand<sup>5</sup>. An independently evaluated 2C contingent resource in the Pannonian Basin underpins the project, supported by historical wells, modern seismic, and legacy production data<sup>6</sup>.</p><p>In June 2026, the company <a href="https://www.valuethemarkets.com/analysis/cancambria-jv-process-nears-commercial-terms?utm_source&#61;website&amp;utm_medium&#61;ids3&amp;utm_campaign&#61;cc001"><u>announced</u></a> that technical due diligence had been completed by prospective strategic partners and that commercial negotiations are underway, marking meaningful progress in the joint venture process led by Raiffeisen Bank International<sup>7</sup>. The farmout targets up to a 50% interest in the Kiskunhalas license to fund an initial drilling program. Subject to completion of the JV process, the company anticipates drilling could commence in Q1 2027, with first gas production targeted for mid-2027. Independent consultancy CHPE assigned a risked NPV10 of approximately US$1.76 billion to the Phase 1 development, based on a January 2025 price forecast and subject to execution, pricing, and cost assumptions<sup>6</sup>.</p><p>&#34;Europe is probably the most attractive market anywhere in the world for E&amp;P companies to operate.&#34; — Dr. Paul Clarke, CEO and President<sup>8</sup></p><p>In a recent <a href="https://www.valuethemarkets.com/analysis/europes-gas-gap-and-the-hungary-play?utm_source&#61;website&amp;utm_medium&#61;ids3&amp;utm_campaign&#61;cc001"><u>interview with ValueTheMarkets</u></a>, Clarke also walked through the single-well economics, the JV timeline, and the 12 to 18 month milestone roadmap in detail.</p><p>CanCambria is a pre-revenue company at an early stage of development. Investors should weigh the potential scale against the material risks of a company that has not yet established commercial production and remains dependent on securing joint venture funding.</p><h2 id="global-gass-new-frontiers"><a href="#global-gass-new-frontiers">#</a>Global Gas&#039;s New Frontiers</h2><p>The geography of global gas supply has shifted in ways that are structural rather than cyclical. The regions that need the most gas are becoming less able to source it cheaply from where they historically sourced it, and how that tension resolves over the coming decade may well be shaped by investment decisions being made right now, in basins most investors have never heard of.</p><div class="not-prose vtm-cta vtm-cta--dark">
    
            <div class="vtm-cta__eyebrow">
            Investor Report
        </div>
    
            <span class="vtm-cta__headline">
            Discover the CanCambria Energy Story
        </span>
    
            <div class="vtm-cta__body">
            <p></p>
        </div>
    
            <div class="mb-8 not-prose">
            <a href="https://www.valuethemarkets.com/analysis/market-reports-guides/reports/cancambria-energy-unlocking-europes-gas-gap?utm_source&#61;website&amp;utm_medium&#61;ids3&amp;utm_campaign&#61;cc001&amp;utm_content&#61;final" class="btn btn-primary">
                Learn More
            </a>
        </div>
    
    </div>
<p></p>
                ]]>
            </content>
                                                <category term="Investing Data Stories" />
            
            <published>2026-07-06T15:04:39+00:00</published>
            <updated>2026-07-14T08:34:14+00:00</updated>
        </entry>
            <entry>
            <title><![CDATA[Tracked: Europe&#039;s LNG Imports Are Causing A Supply Shift]]></title>
            <link rel="alternate" href="https://www.valuethemarkets.com/investing-data-story/tracked-europes-lng-imports-are-causing-a-supply-shift" />
            <id>https://www.valuethemarkets.com/33212</id>
            <author>
                <name><![CDATA[Kirsteen Mackay]]></name>
                        <email><![CDATA[kirsteen.mackay@digitonic.co.uk]]></email>
                    </author>
            <summary type="html">
                <![CDATA[As Europe's reliance on imported LNG deepens and domestic output falls, the conditions favouring investment in local gas supply are becoming difficult to ignore.]]>
            </summary>
                        <content type="html">
                <![CDATA[
                                        <p><a href="https://www.valuethemarkets.com/investing-data-story/tracked-europes-lng-imports-are-causing-a-supply-shift"><img alt="Tracked: Europe&#039;s LNG Imports Are Causing A Supply Shift" src="https://www.valuethemarkets.com/curator/media/00dab084-9a75-40f1-9e20-8659d6722161.jpg?fm=webp&amp;q=80&amp;s=5b611250eb54a641cc64e7a0136fdf94" /></a></p>
                                        <div>
                    <a href="https://www.valuethemarkets.com/analysis/market-reports-guides/reports/cancambria-energy-unlocking-europes-gas-gap?utm_source&#61;website&amp;utm_medium&#61;ids2&amp;utm_campaign&#61;cc001&amp;utm_content&#61;ids" rel="noopener noreferrer">
            <figure class>
                                    <img src="/curator/media/97730af6-b105-4eb9-9fda-5c9a04e0ac1f.jpg?fm&#61;webp&amp;q&#61;80&amp;s&#61;13e82f397fdfd7b159a23619eab2b197" alt="Tracked: The Supply Shift Behind Europe’s LNG Imports" width="1200" height="1500" />
                                                   </figure>
            </a>
            </div>
<p><strong>Sponsored by: CanCambria Energy. </strong>European gas supply remains constrained, with pricing consistently above North American benchmarks. CanCambria is targeting this gap with a large-scale tight gas project in southern Hungary. <a href="https://www.valuethemarkets.com/analysis/market-reports-guides/reports/cancambria-energy-unlocking-europes-gas-gap"><strong><u>Access our Exclusive Investor Report on</u></strong></a><strong><u><a href="https://www.valuethemarkets.com/analysis/market-reports-guides/reports/cancambria-energy-unlocking-europes-gas-gap?utm_source&#61;website&amp;utm_medium&#61;ids2&amp;utm_campaign&#61;cc001&amp;utm_content&#61;top"> </a><a href="https://www.valuethemarkets.com/analysis/market-reports-guides/reports/cancambria-energy-unlocking-europes-gas-gap">CanCambria Energy</a></u></strong>.</p><h2 id="europe-is-importing-more-gas"><a href="#europe-is-importing-more-gas">#</a>Europe Is Importing More Gas</h2><p>Europe&#039;s reliance on imported liquefied natural gas (LNG) has increased sharply since 2020<sup>1</sup>. Monthly LNG arrivals have climbed materially over the past six years, despite seasonal swings and short-term volatility.</p><p>That growth has helped replace falling domestic production and lower Russian pipeline flows. But it has also created a new dependency. Europe now relies heavily on fuel shipped across long and often fragile global supply routes. It has not, however, fully closed that gap. Total gas imports across all sources remain below pre-2022 levels, as the scale of lost Russian pipeline volumes exceeds what LNG growth has offset.</p><p>This growing reliance on seaborne LNG improves supply access, but it also imports geopolitical risk, freight exposure, and price volatility.</p><table><tbody><tr><td rowspan="1" colspan="1"><p></p></td><td rowspan="1" colspan="5"><p style="text-align: center;">EU LNG Imports by Region (MCM), Q1 2026</p></td></tr><tr><td rowspan="1" colspan="1"><p></p></td><td rowspan="1" colspan="1"><p style="text-align: center;"><strong>America</strong></p></td><td rowspan="1" colspan="1"><p style="text-align: center;"><strong>Africa</strong></p></td><td rowspan="1" colspan="1"><p style="text-align: center;"><strong>Middle East</strong></p></td><td rowspan="1" colspan="1"><p style="text-align: center;"><strong>Russia</strong></p></td><td rowspan="1" colspan="1"><p style="text-align: center;"><strong>Other</strong></p></td></tr><tr><td rowspan="1" colspan="1"><p><strong>January 2026</strong></p></td><td rowspan="1" colspan="1"><p style="text-align: center;">7,956</p></td><td rowspan="1" colspan="1"><p style="text-align: center;">772</p></td><td rowspan="1" colspan="1"><p style="text-align: center;">571</p></td><td rowspan="1" colspan="1"><p style="text-align: center;">2,276</p></td><td rowspan="1" colspan="1"><p style="text-align: center;">641</p></td></tr><tr><td rowspan="1" colspan="1"><p><strong>February 2026</strong></p></td><td rowspan="1" colspan="1"><p style="text-align: center;">7,674</p></td><td rowspan="1" colspan="1"><p style="text-align: center;">1,623</p></td><td rowspan="1" colspan="1"><p style="text-align: center;">820</p></td><td rowspan="1" colspan="1"><p style="text-align: center;">2,072</p></td><td rowspan="1" colspan="1"><p style="text-align: center;">648</p></td></tr><tr><td rowspan="1" colspan="1"><p><strong>March 2026</strong></p></td><td rowspan="1" colspan="1"><p style="text-align: center;">8,271</p></td><td rowspan="1" colspan="1"><p style="text-align: center;">1,824</p></td><td rowspan="1" colspan="1"><p style="text-align: center;">1,093</p></td><td rowspan="1" colspan="1"><p style="text-align: center;">2,459</p></td><td rowspan="1" colspan="1"><p style="text-align: center;">484</p></td></tr></tbody></table><p><strong>Source:</strong> Bruegal<sup>1</sup></p><h2 id="five-things-investors-should-know"><a href="#five-things-investors-should-know">#</a>Five Things Investors Should Know</h2><ul><li><p><strong>Higher imports mean higher infrastructure demand. </strong>Storage, regasification (converting LNG back into gas for pipeline distribution), and pipeline networks remain central to Europe’s energy system, and utilisation across all three has risen alongside import volumes.</p></li><li><p><strong>Long-distance supply chains amplify price volatility.</strong> Disruption anywhere in the LNG chain can move European gas prices quickly and without warning.</p></li><li><p><strong>Geopolitics now shapes pricing.</strong> Conflicts affecting major LNG exporters can tighten supply overnight, as markets in 2026 demonstrated when prices reached their highest levels since the 2022/23 energy crisis.</p></li><li><p><strong>Domestic and near-shore gas production carries strategic value. </strong>Gas produced closer to demand centres offers supply security that long-haul LNG cannot match, and markets have historically reflected that difference during periods of tightness.</p></li><li><p><strong>Policy is shifting toward diversification.</strong> European governments are reviewing domestic supply incentives, storage targets, and energy resilience, creating a more supportive backdrop for closer-to-market production.</p></li><li><p><strong>Storage levels are historically low.</strong> EU gas storage entered spring 2026 at 32% of capacity, below seasonal norms. Refilling storage ahead of next winter will require sustained high import volumes, adding further support to near-term European gas demand and pricing.</p></li></ul><h2 id="america-has-become-europes-main-supplier"><a href="#america-has-become-europes-main-supplier">#</a>America Has Become Europe’s Main Supplier</h2><p>The United States is now Europe’s largest LNG supplier, accounting for more than 60% of deliveries during the 2025 to 2026 heating season<sup>2</sup>.</p><p>That has helped stabilize supply. New export projects in Louisiana and Texas have added meaningful capacity, giving Europe access to cargoes not locked into fixed destinations, which can be redirected when markets tighten.</p><p>But concentration creates a different kind of risk.</p><p>Extreme weather, pipeline constraints, or rising domestic US demand can reduce export availability. Europe has replaced one major dependency with another, even if this one is more market-driven and less politically directed.</p><h2 id="global-disruption-still-hits-europe-fast"><a href="#global-disruption-still-hits-europe-fast">#</a>Global Disruption Still Hits Europe Fast</h2><p>The 2026 Middle East disruption showed how exposed LNG markets remain. A sharp drop in supply pushed European gas prices to their highest monthly average since January 2023, and volatility spiked across both European and Asian markets simultaneously. Even buyers with limited direct exposure to the affected region felt the impact.</p><p>That matters for investors.</p><p>Europe does not simply compete for gas. It competes for globally traded cargoes that can be redirected wherever pricing is strongest. When supply tightens, that competition is immediate and indiscriminate. For instance, following the closure of the Strait of Hormuz, a critical chokepoint for Middle East energy exports, in March, Asian LNG price rises on open markets incentivised diversions of uncontracted LNG cargoes towards Asian markets<sup>3</sup>.</p><h2 id="declining-domestic-output-leaves-europe-more-exposed"><a href="#declining-domestic-output-leaves-europe-more-exposed">#</a>Declining Domestic Output Leaves Europe More Exposed</h2><p>While imports have risen, Europe&#039;s own gas output has continued to fall. Production declines in the UK North Sea and the Netherlands are structural, not cyclical, reflecting the depletion of mature fields and, in some cases, deliberate policy decisions to wind down extraction. Norway remains the continent&#039;s largest domestic supplier, but growth there is limited.</p><p>That leaves LNG to fill a widening gap. The longer that gap grows, the greater the value of reliable, closer-to-market production. Projects that can supply European demand directly may offer shorter supply chains, lower freight exposure, and stronger pricing support during periods of tightness.</p><p>That is the structural investment case investors should watch.</p><h2 id="cancambria-targets-europes-gas-gap"><a href="#cancambria-targets-europes-gas-gap">#</a><strong>CanCambria Targets Europe’s Gas Gap</strong></h2><p><strong>CanCambria Energy Corp. </strong>(TSXV: CCEC) (OTCQB: CCEYF) (FSE: 4JH) is advancing its 100%-owned Kiskunhalas tight-gas project in southern Hungary, targeting a structurally tight European gas market where domestic supply remains constrained and prices trade well above North American benchmarks<sup>4</sup>.</p><p>The company’s flagship project is built around a large, independently evaluated gas-condensate resource in the Pannonian Basin. Historical wells, modern seismic and legacy production data confirm a proven hydrocarbon system.</p><p>CanCambria’s near-term strategy is focused on funding and drilling an initial three-well appraisal program, with first wells targeted for late 2026 and first gas sales expected in early 2027. At US$4/MMBtu, the breakeven gas price for the CanCambria project, compares favorably to the current European gas price.The project benefits from proximity to existing pipeline infrastructure, potentially shortening the path from first flow to revenue if initial results support the development model.</p><p>The company has also identified a shallow 350 km² high-impact exploration trend within the Kiskunhalas Concession Area. Multiple leads and prospects have emerged from legacy 2D seismic across a basin that has produced more than 160 million BOE, adding potential lower-cost, faster-cycle upside alongside the deeper tight-gas opportunity.</p><p>CEO and President Dr. Paul Clarke commented<sup>5</sup>:</p><blockquote><p><strong><em>Hydrocarbon discoveries are commonly made by applying new exploration technologies within proven basins, and that is exactly the opportunity we see emerging at Kiskunhalas.</em></strong></p></blockquote><div class="not-prose vtm-cta vtm-cta--light">
    
            <div class="vtm-cta__eyebrow">
            Investor Report
        </div>
    
            <span class="vtm-cta__headline">
            Discover the CanCambria Energy Story →
        </span>
    
            <div class="vtm-cta__body">
            <p></p>
        </div>
    
            <div class="mb-8 not-prose">
            <a href="https://www.valuethemarkets.com/analysis/market-reports-guides/reports/cancambria-energy-unlocking-europes-gas-gap?utm_source&#61;website&amp;utm_medium&#61;ids2&amp;utm_campaign&#61;cc001&amp;utm_content&#61;mid" class="btn btn-secondary">
                Explore CanCambria Energy
            </a>
        </div>
    
    </div>
<h2 id="faqs"><a href="#faqs">#</a>FAQs</h2><h3 id="why-is-europe-importing-more-lng"><a href="#why-is-europe-importing-more-lng">#</a>Why is Europe importing more LNG?</h3><p>Domestic production is declining and pipeline imports from Russia have fallen sharply, increasing structural reliance on seaborne LNG to meet demand.</p><h3 id="why-does-supply-location-matter"><a href="#why-does-supply-location-matter">#</a>Why does supply location matter?</h3><p>Closer supply reduces shipping risk, lowers freight exposure, and improves delivery reliability. Long-haul LNG is subject to freight rate spikes, vessel availability constraints, and transit chokepoints that nearby pipeline or short-haul supply avoids.</p><h3 id="does-us-supply-solve-europes-energy-problem"><a href="#does-us-supply-solve-europes-energy-problem">#</a>Does US supply solve Europe&#039;s energy problem?</h3><p>It has meaningfully improved supply access and flexibility. But relying heavily on a single supplier still creates concentration risk, particularly when domestic US demand or weather events constrain export availability.</p><h3 id="could-europe-increase-domestic-production"><a href="#could-europe-increase-domestic-production">#</a>Could Europe increase domestic production?</h3><p>Policy direction, available capital, and project execution will all determine the pace. What has changed is the urgency of the conversation. Supply security is now a central policy priority across the continent, and that is shifting the conditions under which new domestic projects are evaluated.</p><div class="not-prose vtm-cta vtm-cta--dark">
    
            <div class="vtm-cta__eyebrow">
            Investor Report
        </div>
    
            <span class="vtm-cta__headline">
            Learn more about CanCambria Energy →
        </span>
    
            <div class="vtm-cta__body">
            <p></p>
        </div>
    
            <div class="mb-8 not-prose">
            <a href="https://www.valuethemarkets.com/analysis/market-reports-guides/reports/cancambria-energy-unlocking-europes-gas-gap?utm_source&#61;website&amp;utm_medium&#61;ids2&amp;utm_campaign&#61;cc001&amp;utm_content&#61;final" class="btn btn-primary">
                Explore CanCambria Energy
            </a>
        </div>
    
    </div>

                ]]>
            </content>
                                                <category term="Investing Data Stories" />
            
            <published>2026-06-04T07:38:09+00:00</published>
            <updated>2026-06-04T16:41:39+00:00</updated>
        </entry>
            <entry>
            <title><![CDATA[9 Small-Mid Caps Quietly Compounding Cash]]></title>
            <link rel="alternate" href="https://www.valuethemarkets.com/investing-data-story/9-small-mid-caps-quietly-compounding-cash" />
            <id>https://www.valuethemarkets.com/31128</id>
            <author>
                <name><![CDATA[Kirsteen Mackay]]></name>
                        <email><![CDATA[kirsteen.mackay@digitonic.co.uk]]></email>
                    </author>
            <summary type="html">
                <![CDATA[These 9 North American small-mid caps stand out for converting revenue into cash, earning strong returns on capital, and carrying low debt.]]>
            </summary>
                        <content type="html">
                <![CDATA[
                                        <p><a href="https://www.valuethemarkets.com/investing-data-story/9-small-mid-caps-quietly-compounding-cash"><img alt="9 Small-Mid Caps Quietly Compounding Cash" src="https://www.valuethemarkets.com/curator/media/69c79cf3-c310-423a-925a-335592b4311d.jpg?fm=webp&amp;q=80&amp;s=2082ee4582799bf4ef69719d4d354a37" /></a></p>
                                        <div>
                <figure class>
                            <img src="/curator/media/7a3aea52-2754-4205-a85a-b309fa2a37ab.jpg?fm&#61;webp&amp;q&#61;80&amp;s&#61;a34060023c00ea3704733d1ebbd32e0a" alt="9 Small-Mid Caps Quietly Compounding Cash " width="1200" height="1500" />
                                        </figure>
    </div>
<h2 id="cash-generation-is-a-useful-test-of-business-quality"><a href="#cash-generation-is-a-useful-test-of-business-quality">#</a>Cash Generation is a Useful Test of Business Quality</h2><p>Free cash flow margin shows how much of every dollar of revenue a company keeps after running the business and reinvesting in it. It is harder to manipulate than earnings, and it tells you whether a company is actually generating spendable cash or just reporting accounting profits. Pair it with strong returns on capital and a clean balance sheet, and you have a reasonable starting point for identifying quality businesses.</p><p>We’ve filtered across US and Canadian equities with market caps between $500 million and $10 billion. Nine names cleared the thresholds. The list spans health care, industrials, info tech, energy, and consumer discretionary, and each company averaged a free cash flow margin above 15% over the past three years.</p><h2 id="9-small-mid-cap-cash-compounders-at-sensible-valuations"><a href="#9-small-mid-cap-cash-compounders-at-sensible-valuations">#</a>9 Small-Mid Cap Cash Compounders At Sensible Valuations</h2><table><tbody><tr><td rowspan="1" colspan="1"><p><strong>Name</strong></p></td><td rowspan="1" colspan="1"><p><strong>Ticker</strong></p></td><td rowspan="1" colspan="1"><p><strong>Market Cap</strong></p></td><td rowspan="1" colspan="1"><p><strong>Sector</strong></p></td><td rowspan="1" colspan="1"><p><strong>FCF Margin 3Y</strong></p></td><td rowspan="1" colspan="1"><p><strong>ROIC 3Y</strong></p></td><td rowspan="1" colspan="1"><p><strong>Net Debt / EBITDA</strong></p></td><td rowspan="1" colspan="1"><p><strong>FCF / EV Yield</strong></p></td></tr><tr><td rowspan="1" colspan="1"><p>Collegium Pharmaceutical</p></td><td rowspan="1" colspan="1"><p>NASDAQ: COLL</p></td><td rowspan="1" colspan="1"><p>$1.1B</p></td><td rowspan="1" colspan="1"><p>Health Care</p></td><td rowspan="1" colspan="1"><p><strong>40.00%</strong></p></td><td rowspan="1" colspan="1"><p>15.15%</p></td><td rowspan="1" colspan="1"><p>1.2x</p></td><td rowspan="1" colspan="1"><p>20.62%</p></td></tr><tr><td rowspan="1" colspan="1"><p>Afya Limited</p></td><td rowspan="1" colspan="1"><p>NASDAQ: AFYA</p></td><td rowspan="1" colspan="1"><p>$1.3B</p></td><td rowspan="1" colspan="1"><p>Consumer Disc.</p></td><td rowspan="1" colspan="1"><p><strong>36.77%</strong></p></td><td rowspan="1" colspan="1"><p>12.89%</p></td><td rowspan="1" colspan="1"><p>1.2x</p></td><td rowspan="1" colspan="1"><p>16.45%</p></td></tr><tr><td rowspan="1" colspan="1"><p>Global Ship Lease</p></td><td rowspan="1" colspan="1"><p>NYSE: GSL</p></td><td rowspan="1" colspan="1"><p>$1.5B</p></td><td rowspan="1" colspan="1"><p>Industrials</p></td><td rowspan="1" colspan="1"><p><strong>36.50%</strong></p></td><td rowspan="1" colspan="1"><p>16.60%</p></td><td rowspan="1" colspan="1"><p>0.5x</p></td><td rowspan="1" colspan="1"><p>21.14%</p></td></tr><tr><td rowspan="1" colspan="1"><p><a href="http://Topicus.com">Topicus.com</a></p></td><td rowspan="1" colspan="1"><p>TSXV: TOI</p></td><td rowspan="1" colspan="1"><p>$5.7B</p></td><td rowspan="1" colspan="1"><p>Info Tech</p></td><td rowspan="1" colspan="1"><p><strong>28.01%</strong></p></td><td rowspan="1" colspan="1"><p>15.65%</p></td><td rowspan="1" colspan="1"><p>0.6x</p></td><td rowspan="1" colspan="1"><p>7.52%</p></td></tr><tr><td rowspan="1" colspan="1"><p>Lantheus Holdings</p></td><td rowspan="1" colspan="1"><p>NASDAQ: LNTH</p></td><td rowspan="1" colspan="1"><p>$6.1B</p></td><td rowspan="1" colspan="1"><p>Health Care</p></td><td rowspan="1" colspan="1"><p><strong>22.88%</strong></p></td><td rowspan="1" colspan="1"><p>17.16%</p></td><td rowspan="1" colspan="1"><p>0.3x</p></td><td rowspan="1" colspan="1"><p>6.09%</p></td></tr><tr><td rowspan="1" colspan="1"><p>Corporación América Airports</p></td><td rowspan="1" colspan="1"><p>NYSE: CAAP</p></td><td rowspan="1" colspan="1"><p>$4.1B</p></td><td rowspan="1" colspan="1"><p>Industrials</p></td><td rowspan="1" colspan="1"><p><strong>22.57%</strong></p></td><td rowspan="1" colspan="1"><p>12.26%</p></td><td rowspan="1" colspan="1"><p>0.4x</p></td><td rowspan="1" colspan="1"><p>10.57%</p></td></tr><tr><td rowspan="1" colspan="1"><p>Riley Exploration Permian</p></td><td rowspan="1" colspan="1"><p>NYSE-A: REPX</p></td><td rowspan="1" colspan="1"><p>$0.8B</p></td><td rowspan="1" colspan="1"><p>Energy</p></td><td rowspan="1" colspan="1"><p><strong>20.74%</strong></p></td><td rowspan="1" colspan="1"><p>18.17%</p></td><td rowspan="1" colspan="1"><p>0.9x</p></td><td rowspan="1" colspan="1"><p>6.24%</p></td></tr><tr><td rowspan="1" colspan="1"><p>Paycom Software</p></td><td rowspan="1" colspan="1"><p>NYSE: PAYC</p></td><td rowspan="1" colspan="1"><p>$6.5B</p></td><td rowspan="1" colspan="1"><p>Info Tech</p></td><td rowspan="1" colspan="1"><p><strong>19.29%</strong></p></td><td rowspan="1" colspan="1"><p>22.64%</p></td><td rowspan="1" colspan="1"><p>0.9x</p></td><td rowspan="1" colspan="1"><p>6.28%</p></td></tr><tr><td rowspan="1" colspan="1"><p>Frontdoor</p></td><td rowspan="1" colspan="1"><p>NASDAQ: FTDR</p></td><td rowspan="1" colspan="1"><p>$4.5B</p></td><td rowspan="1" colspan="1"><p>Consumer Disc.</p></td><td rowspan="1" colspan="1"><p><strong>15.14%</strong></p></td><td rowspan="1" colspan="1"><p>25.11%</p></td><td rowspan="1" colspan="1"><p>1.2x</p></td><td rowspan="1" colspan="1"><p>7.64%</p></td></tr></tbody></table><p><em>Source: Koyfin. Sorted by 3-year average free cash flow margin.</em></p><h2 id="five-things-investors-should-know"><a href="#five-things-investors-should-know">#</a>Five Things Investors Should Know</h2><ul><li><p><strong>The stock selection is a starting point, not a verdict.</strong> It identifies where to look, not what to buy. High cash flow margins, strong returns on capital, and clean balance sheets are necessary conditions for compounding shareholder value, but they are not sufficient ones. Each name still requires individual due diligence on the durability of its cash flows and the price the market is currently asking.</p></li><li><p><strong>Cyclical exposure is the biggest blind spot.</strong> Global Ship Lease (GSL) and Riley Exploration Permian (REPX) generate cash from shipping rates and oil prices, both of which have been near cyclical highs over the three-year window. Mean reversion in either market would compress those margins quickly.</p></li><li><p><strong>Geography matters for some names.</strong> Afya Limited (AFYA) operates in Brazil, and Corporación América Airports (CAAP) runs concessions across Latin America. Operating quality looks real on the numbers, but currency moves and political risk can affect both reported results and the multiple investors are willing to pay.</p></li><li><p><strong>Specialty pharma carries patent timing risk.</strong> Collegium Pharmaceutical (COLL) and Lantheus Holdings (LNTH) earn high cash margins from drug portfolios, but revenue from individual drugs can drop sharply when patents expire or competition arrives. Patent expiry schedules are worth checking before going further.</p></li><li><p><strong>Cash matters less than what management does with it.</strong> A high free cash flow yield is only valuable if the cash gets returned to shareholders through buybacks or dividends, or reinvested at attractive returns. Poorly timed acquisitions or overpriced buybacks can destroy the compounding the numbers were designed to identify.</p></li></ul><h2 id="why-free-cash-flow-margin-is-the-anchor"><a href="#why-free-cash-flow-margin-is-the-anchor">#</a>Why Free Cash Flow Margin Is the Anchor</h2><p>Earnings can be shaped by accounting choices. Free cash flow is closer to the truth. It is what is left after operating costs, taxes, working capital, and capital expenditure. A company that consistently converts 20% or more of revenue into free cash flow is usually doing something structurally right, whether that is pricing power, capital-light operations, recurring revenue, or all three.</p><p>Collegium leads the shortlist at a 40% three-year average margin. Afya and Global Ship Lease follow at around 37%. At the lower end, Frontdoor (FTDR) qualifies at 15.14%, which is still strong for a consumer services business.</p><h2 id="returns-on-capital-confirm-the-quality-signal"><a href="#returns-on-capital-confirm-the-quality-signal">#</a>Returns on Capital Confirm the Quality Signal</h2><p>Free cash flow margin tells you about cash conversion. Return on invested capital (ROIC) tells you whether the business earns more than it costs to fund. All nine names cleared 12% on a three-year average basis, and four exceeded 17%. Frontdoor leads at 25.11%, Paycom Software (PAYC) follows at 22.64%, and Riley Exploration Permian sits at 18.17%.</p><p>When a company combines high cash margins with high returns on capital, it suggests the cash is being earned in a structurally attractive business, not just borrowed against the balance sheet.</p><h2 id="leverage-is-low-across-the-group"><a href="#leverage-is-low-across-the-group">#</a>Leverage is Low Across the Group</h2><p>Net debt to EBITDA is a basic measure of how much debt a company carries relative to its earnings power. The whole list sits at or below 1.2x, with Lantheus the most conservative at 0.3x. Low leverage gives management flexibility to keep investing through downturns, repurchase shares opportunistically, or absorb shocks without distress. It also reduces the chance that quality cash flows get diverted into servicing debt.</p><h2 id="why-financials-real-estate-and-utilities-do-not-appear"><a href="#why-financials-real-estate-and-utilities-do-not-appear">#</a>Why Financials, Real Estate, and Utilities Do Not Appear</h2><p>Financial and real estate companies are excluded because free cash flow is not a meaningful measure for those business models. Banks, insurers, and REITs are better assessed using sector-specific metrics. Utilities are eligible but none cleared the quality thresholds for cash flow margin, return on capital, and leverage. That is largely a function of the capital intensity of the business.</p><h2 id="what-the-numbers-cannot-see"><a href="#what-the-numbers-cannot-see">#</a>What the Numbers Cannot See</h2><p>The data does the first 20% of the work. It tells you where to look. The remaining 80% is on the investor. Durability of cash flows, competitive position, capital allocation track record, and the valuation paid for the cash. Several names on this list also carry sector-specific risks that quantitative filters cannot capture, including commodity cycles, AI disruption in software, and regulatory exposure in pharma. None of that disqualifies the names. It just means the data is a starting line, not a finish line.</p><h2 id="faqs"><a href="#faqs">#</a>FAQs</h2><h3 id="what-is-free-cash-flow"><a href="#what-is-free-cash-flow">#</a>What is free cash flow?</h3><p>Free cash flow measures the cash a company generates after paying operating expenses and capital investments. It reflects the money available for dividends, buybacks, debt reduction, or expansion.</p><h3 id="what-is-a-good-free-cash-flow-margin"><a href="#what-is-a-good-free-cash-flow-margin">#</a>What is a good free cash flow margin?</h3><p>Higher margins indicate stronger efficiency. Technology companies often report margins above 20%, while capital intensive industries may run closer to 10% to 15%.</p><h3 id="what-is-fcfev-yield-and-why-does-it-matter"><a href="#what-is-fcfev-yield-and-why-does-it-matter">#</a>What is FCF/EV yield, and why does it matter?</h3><p>Free cash flow divided by enterprise value tells you what cash yield you get for buying the whole business at current prices, including debt. It is a rough valuation check. Higher yields can indicate cheaper pricing, but they can also reflect risks the market has identified that the numbers have not.</p><h3 id="how-should-i-use-this-list"><a href="#how-should-i-use-this-list">#</a>How should I use this list?</h3><p>Treat the nine names as research candidates, not recommendations. The next steps would normally include reading recent filings, checking valuation against historical ranges and peers, and assessing the durability of cash flows in each company&#039;s specific market.</p>
                ]]>
            </content>
                                                <category term="Investing Data Stories" />
            
            <published>2026-05-25T05:52:25+00:00</published>
            <updated>2026-05-25T06:05:09+00:00</updated>
        </entry>
            <entry>
            <title><![CDATA[Visualized: Natural Gas Price Gaps Reshape Global Energy Trade]]></title>
            <link rel="alternate" href="https://www.valuethemarkets.com/investing-data-story/visualized-natural-gas-price-gaps-reshape-global-energy-trade" />
            <id>https://www.valuethemarkets.com/28865</id>
            <author>
                <name><![CDATA[Kirsteen Mackay]]></name>
                        <email><![CDATA[kirsteen.mackay@digitonic.co.uk]]></email>
                    </author>
            <summary type="html">
                <![CDATA[Global gas benchmarks show a wide price gap, with North America far below Europe and Asia, shaping trade, margins, and energy stocks.]]>
            </summary>
                        <content type="html">
                <![CDATA[
                                        <p><a href="https://www.valuethemarkets.com/investing-data-story/visualized-natural-gas-price-gaps-reshape-global-energy-trade"><img alt="Visualized: Natural Gas Price Gaps Reshape Global Energy Trade" src="https://www.valuethemarkets.com/curator/c4b2542e-2af9-4b9e-99c2-dbdc80c8b51d.jpg?fm=webp&amp;q=80&amp;s=a4b3f16587fed535acccf32515d6e681" /></a></p>
                                        <div>
                <figure class>
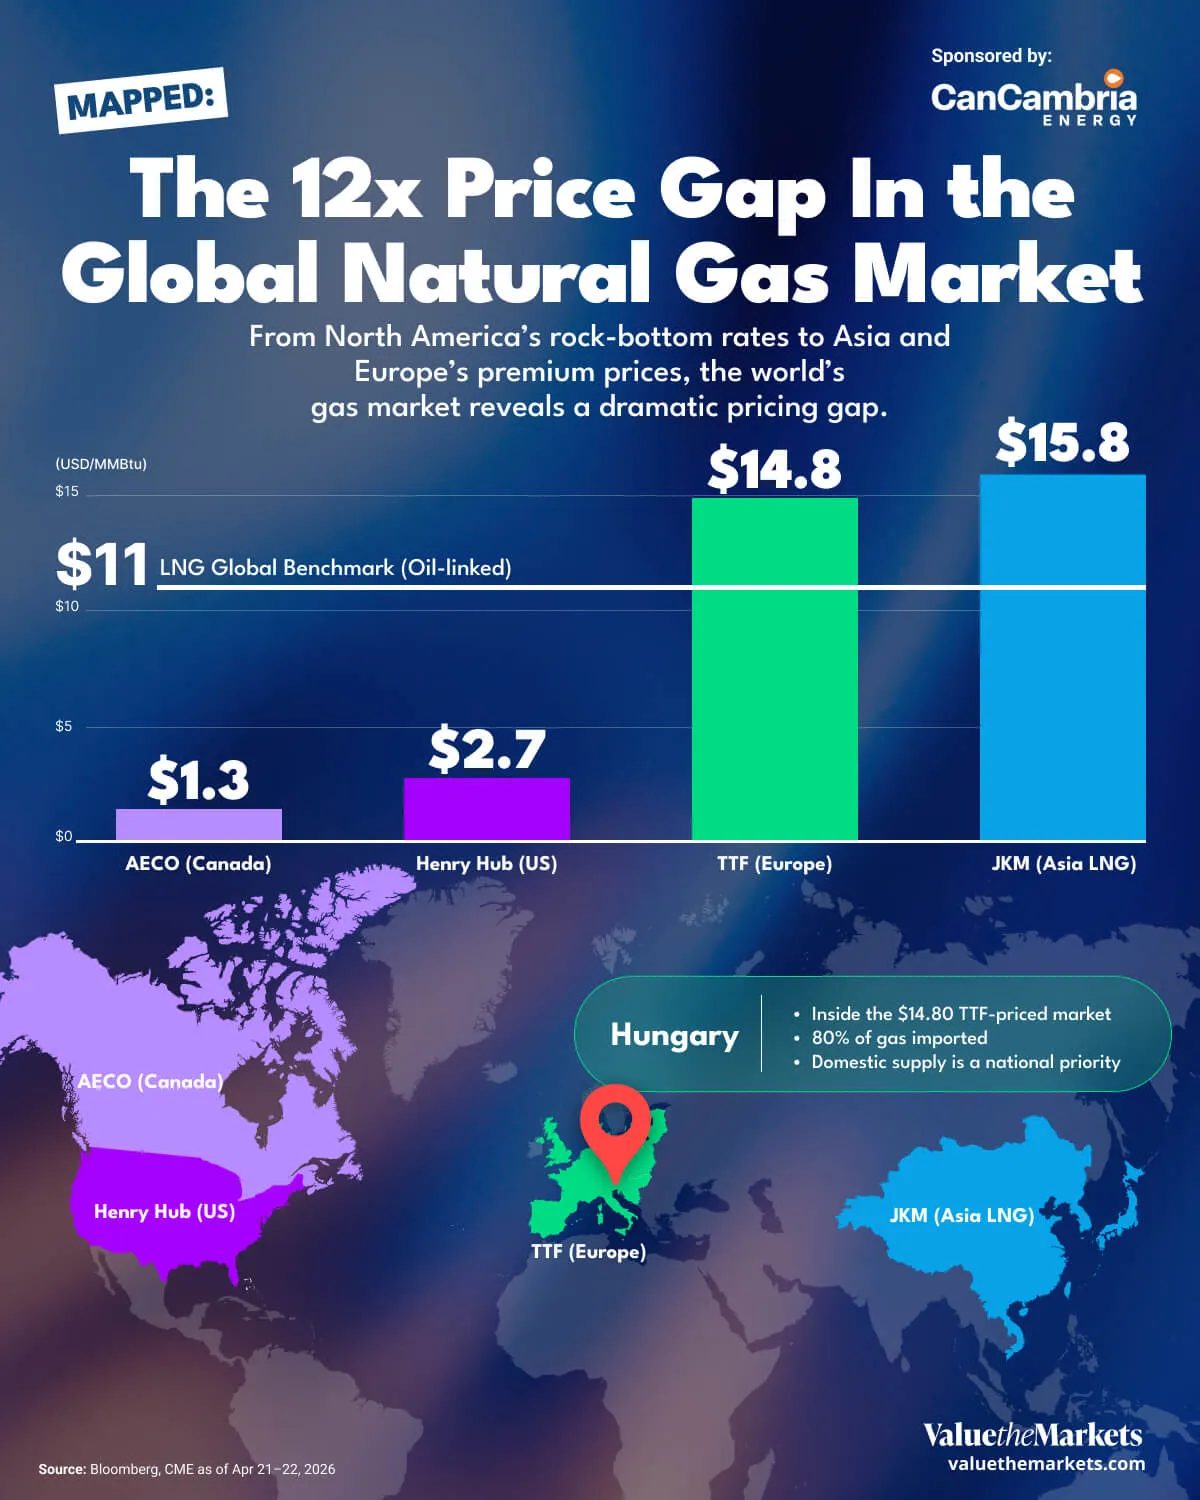
                            <img src="/curator/df3071cf-e5a2-43cb-a378-e51d80612222.jpg?fm&#61;webp&amp;q&#61;80&amp;s&#61;cb014d2883177bffd21dd6c790d2b135" alt="Chart showing natural gas prices: Canada $1.3, US $2.7, Europe $14.8, Asia LNG $15.8, with $11 global benchmark" width="1200" height="1500" />
                                        </figure>
    </div>
<p><br /><strong>Sponsored by: CanCambria Energy. </strong>European gas supply remains constrained, with pricing consistently above North American benchmarks. CanCambria is targeting this gap with a large-scale tight gas project in southern Hungary. <a href="https://www.valuethemarkets.com/analysis/market-reports-guides/reports/cancambria-energy-unlocking-europes-gas-gap" target="_blank" rel="noopener noreferrer nofollow"><strong><u>Access our Exclusive Investor Report on CanCambria Energy</u></strong></a>.</p><h2 id="global-gas-prices-show-a-wide-regional-split"><a href="#global-gas-prices-show-a-wide-regional-split">#</a>Global Gas Prices Show A Wide Regional Split</h2><p>Recent benchmark data shows a global gas market that is still deeply fragmented. As of late April 2026, Henry Hub in the US sits at $2.70 per MMBtu, while AECO in Canada is even lower at $1.30. In Europe, TTF stands at $14.80, and in Asia, JKM is $15.80. Oil linked LNG contracts are estimated around $11 to $13. That vast spread between North American and European benchmarks is not a quirk of seasonality. It reflects a market under structural stress, shaped by a Middle East conflict, constrained infrastructure, and a cargo routing battle playing out across the Atlantic and Pacific basins.</p><p>The key takeaway is simple. Gas is not one global price. It is a set of regional prices shaped by pipeline limits, LNG export capacity, storage levels, weather, and contract structure. That helps explain why a producer in Alberta faces a very different market than an LNG seller targeting Asia.</p><table><tbody><tr><td rowspan="1" colspan="1"><p><strong>Benchmark</strong></p></td><td rowspan="1" colspan="1"><p><strong>Price</strong></p></td><td rowspan="1" colspan="1"><p><strong>Note</strong></p></td></tr><tr><td rowspan="1" colspan="1"><p><strong>Henry Hub (US):</strong></p></td><td rowspan="1" colspan="1"><p><strong>$2.70</strong></p></td><td rowspan="1" colspan="1"><p>Sourced from NYMEX front-month futures<sup>1</sup></p></td></tr><tr><td rowspan="1" colspan="1"><p><strong>AECO (Canada)</strong></p></td><td rowspan="1" colspan="1"><p><strong>$1.30</strong></p></td><td rowspan="1" colspan="1"><p>Alberta hub spot<sup>2</sup>, converted from CAD$1.70/GJ</p></td></tr><tr><td rowspan="1" colspan="1"><p><strong>TTF (Europe)</strong></p></td><td rowspan="1" colspan="1"><p><strong>$14.80</strong></p></td><td rowspan="1" colspan="1"><p>Front-month Dutch TTF<sup>3</sup>, converted from €42.92/MWh</p></td></tr><tr><td rowspan="1" colspan="1"><p><strong>JKM (Asia LNG)</strong></p></td><td rowspan="1" colspan="1"><p><strong>$15.80</strong></p></td><td rowspan="1" colspan="1"><p>CME front-month swap linked to Platts JKM<sup>4</sup> (~$15.80/MMBtu, Apr 21, 2026), used as proxy for Asian spot LNG</p></td></tr><tr><td rowspan="1" colspan="1"><p><strong>Oil-linked LNG (global)</strong></p></td><td rowspan="1" colspan="1"><p><strong>$11–$13</strong></p></td><td rowspan="1" colspan="1"><p>Oil-linked LNG price: calculated from long-term supply contracts where LNG is priced as a fixed percentage of the Brent crude oil price<sup>5</sup>, not a live market quote.</p></td></tr></tbody></table><p><em>Prices approximate as of April 21-22, 2026</em></p><h2 id="five-things-investors-should-know"><a href="#five-things-investors-should-know">#</a>Five Things Investors Should Know</h2><ol start="1"><li><p><strong>The spread between regions is structural, not seasonal. </strong>North American prices are low because production is abundant and export capacity is finite. European and Asian prices are high because those regions depend on imports, and import-dependent markets pay a premium for supply security.</p></li><li><p><strong>Low North American prices create winners and losers.</strong> Henry Hub at $2.70 and AECO at $1.30 weigh on upstream producers with limited pipeline access. But they benefit LNG exporters buying cheap feedgas, gas-fired utilities, and petrochemical producers.</p></li><li><p><strong>Europe pays a structurally elevated price for imported gas. </strong>TTF at $14.80 reflects declining domestic output and a sustained shift toward LNG imports. That premium has been a consistent feature of European gas markets since 2021 and the underlying supply constraints have not been resolved.</p></li><li><p><strong>Contract structure shapes how benchmark prices translate to earnings.</strong> Many LNG deals are indexed to oil rather than spot gas. At $11-13 per MMBtu, oil-linked contracts sit below current TTF and JKM levels, meaning revenue can lag when spot prices spike.</p></li><li><p><strong>European storage trajectory is a key risk variable.</strong> When storage enters winter below the five-year average, the market becomes more sensitive to cold weather. That sensitivity tends to keep prices elevated and volatile through the heating season.</p></li></ol><h2 id="north-america-is-oversupplied-europe-is-not"><a href="#north-america-is-oversupplied-europe-is-not">#</a>North America Is Oversupplied, Europe Is Not</h2><p>Henry Hub at $2.70 reflects a market where production is running ahead of export capacity. AECO&#039;s deeper discount reflects additional pipeline constraints in Western Canada that directly compress producer margins. That cheap feedgas is precisely what makes North American LNG export projects attractive to buyers in higher-priced markets overseas.</p><p>Europe&#039;s situation is the inverse. Domestic output has been in structural decline for over a decade. The region has responded by building LNG import capacity and competing on global spot markets. A gas project producing within Europe avoids that import chain entirely, supplying into a market that is structurally short, pays premium prices, and has strong policy incentives to support local production.</p><h2 id="asia-and-oil-linked-contracts-round-out-the-picture"><a href="#asia-and-oil-linked-contracts-round-out-the-picture">#</a>Asia and Oil-Linked Contracts Round Out the Picture</h2><p>JKM at $15.80 reflects Asia&#039;s heavy reliance on imported LNG, with limited pipeline alternatives and less storage capacity relative to demand. Prices are high but more volatile than TTF, driven by weather, shipping constraints, and cargo routing decisions.</p><p>Oil-linked LNG at $11-13 sits above North American benchmarks but below current spot levels in Europe and Asia. Because these contracts typically price off Brent with a multi-month lag, sellers do not capture the full upside when spot prices spike. Contract mix shapes cash flow timing and earnings predictability in ways that matter when comparing LNG-exposed companies.</p><p>The regional gaps visible in this data reflect years of underinvestment in European domestic supply and growing import dependency across Asia, and they are not expected to close quickly.</p><h2 id="cancambria-targets-europes-gas-gap"><a href="#cancambria-targets-europes-gas-gap">#</a>CanCambria Targets Europe’s Gas Gap</h2><p><strong>CanCambria Energy Corp. </strong>(TSXV: CCEC) (OTCQB: CCEYF) (FSE: 4JH) is advancing its 100%-owned Kiskunhalas tight-gas project in southern Hungary, targeting a structurally tight European gas market where domestic supply remains constrained and prices trade well above North American benchmarks<sup>6</sup>.</p><p>The company’s flagship project is built around a large, independently evaluated gas-condensate resource in the Pannonian Basin. Historical wells, modern seismic and legacy production data confirm a proven hydrocarbon system.</p><p>CanCambria’s near-term strategy is focused on funding and drilling an initial three-well appraisal program, with first wells targeted for late 2026 and first gas sales expected in early 2027. At US$4/MMBtu, the breakeven gas price for the CanCambria project, compares favorably to the current European gas price.The project benefits from proximity to existing pipeline infrastructure, potentially shortening the path from first flow to revenue if initial results support the development model.</p><p>The company has also identified a shallow 350 km² high-impact exploration trend within the Kiskunhalas Concession Area. Multiple leads and prospects have emerged from legacy 2D seismic across a basin that has produced more than 160 million BOE, adding potential lower-cost, faster-cycle upside alongside the deeper tight-gas opportunity.</p><p>CEO and President Dr. Paul Clarke commented<sup>7</sup>:</p><blockquote><p><em>Hydrocarbon discoveries are commonly made by applying new exploration technologies within proven basins, and that is exactly the opportunity we see emerging at Kiskunhalas.</em></p></blockquote><h2 id="learn-more-about-cancambria-energy"><a href="#learn-more-about-cancambria-energy">#</a><a href="https://www.valuethemarkets.com/analysis/market-reports-guides/reports/cancambria-energy-unlocking-europes-gas-gap" target="_blank" rel="noopener noreferrer nofollow"><strong><u>Learn more about CanCambria Energy →</u></strong></a></h2>
                ]]>
            </content>
                                                <category term="Investing Data Stories" />
            
            <published>2026-05-08T12:23:22+00:00</published>
            <updated>2026-05-11T15:00:36+00:00</updated>
        </entry>
            <entry>
            <title><![CDATA[Charted: World Copper Reserves and Mine Production ]]></title>
            <link rel="alternate" href="https://www.valuethemarkets.com/investing-data-story/charted-world-copper-reserves-and-mine-production" />
            <id>https://www.valuethemarkets.com/20646</id>
            <author>
                <name><![CDATA[Kirsteen Mackay]]></name>
                        <email><![CDATA[kirsteen.mackay@digitonic.co.uk]]></email>
                    </author>
            <summary type="html">
                <![CDATA[Copper is not running out, but economic supply is tighter than it appears. Here is what that means for prices and mining stocks.]]>
            </summary>
                        <content type="html">
                <![CDATA[
                                        <p><a href="https://www.valuethemarkets.com/investing-data-story/charted-world-copper-reserves-and-mine-production"><img alt="Charted: World Copper Reserves and Mine Production " src="https://www.valuethemarkets.com/curator/media/CM004 _ M02_IDS 1 _ Featured Image.jpg?fm=webp&amp;q=80&amp;s=47321ffd648ed9bf28842217db1758b2" /></a></p>
                                        <div>
                <figure class>
                            <img src="/curator/media/CM004%20_%20M02_IDS%201.jpg?fm&#61;webp&amp;q&#61;80&amp;s&#61;db548c783e23df07c712bfdd9c56492d" alt="World Copper Reserves and Mine Production IDS" width="1200" height="1500" />
                                        </figure>
    </div>
<p><strong>Sponsored by: Canterra Minerals. </strong>With active drill programs, multiple emerging targets, and recent discoveries, Canterra is advancing a portfolio of copper and gold assets in central Newfoundland.<strong> </strong><a href="https://www.valuethemarkets.com/analysis/market-reports-guides/reports/fully-funded-copper-gold-explorer-backed-by-experienced-investors?utm_source&#61;ids&amp;utm_medium&#61;website&amp;utm_campaign&#61;cm004&amp;utm_id&#61;ids1m02" target="_blank" rel="noopener noreferrer nofollow"><u>Access our Exclusive Investor Report on Canterra Minerals</u></a>.</p><h2 id="why-copper-supply-is-tighter-than-it-looks"><a href="#why-copper-supply-is-tighter-than-it-looks">#</a>Why Copper Supply Is Tighter Than It Looks</h2><p>Copper Mining Supply Depends on Reserves, these represent about 980 million metric tonnes (Mt), while identified resources exceed 2,100 Mt, and total resources approach 5,600 Mt. The difference between these categories drives long-term pricing and mining equity performance. Only reserves support mine plans and cash flow today. The rest require higher prices, improved technology, or further development before they become economically viable.</p><h2 id="why-copper-reserves-are-important-for-retail-investors"><a href="#why-copper-reserves-are-important-for-retail-investors">#</a>Why Copper Reserves Are Important For Retail Investors</h2><ul><li><p>Reserves drive near term earnings and cash flow</p></li><li><p>Higher copper prices can convert resources into reserves</p></li><li><p>Supply growth requires constant capital spending</p></li><li><p>Long <a href="https://www.valuethemarkets.com/investing-data-story/ranked-where-exploration-approvals-move-fastest?utm_source&#61;ids&amp;utm_medium&#61;website&amp;utm_campaign&#61;cm004&amp;utm_id&#61;ids1m02" target="_blank" rel="noopener noreferrer nofollow"><u>permitting timelines</u></a> slow new mine development</p></li><li><p>Electrification trends increase long-term copper demand</p></li></ul><p>Reserves also underpin mine life estimates and net asset value calculations used in equity valuation. If you own mining stocks, you are investing in reserves, not abstract geological estimates.</p><table><tbody><tr><td rowspan="1" colspan="1"><p><strong>Layer</strong></p></td><td rowspan="1" colspan="1"><p><strong>Figure</strong></p></td></tr><tr><td rowspan="1" colspan="1"><p><strong>Total Resources:</strong> Identified &#43; Estimated Undiscovered</p></td><td rowspan="1" colspan="1"><p>5,600 Mt</p></td></tr><tr><td rowspan="1" colspan="1"><p><strong>Identified Resources:</strong> Located And Geologically Assessed</p></td><td rowspan="1" colspan="1"><p>2,100 Mt</p></td></tr><tr><td rowspan="1" colspan="1"><p><strong>Reserves:</strong> Economic To Mine Today</p></td><td rowspan="1" colspan="1"><p>980 Mt</p></td></tr><tr><td rowspan="1" colspan="1"><p><strong>Mine Capacity: </strong>Max Annual Output Possible</p></td><td rowspan="1" colspan="1"><p>28 Mt/year</p></td></tr><tr><td rowspan="1" colspan="1"><p><strong>Mine Production:</strong> Actual 2024 Output</p></td><td rowspan="1" colspan="1"><p>23 Mt/year</p></td></tr></tbody></table><h2 id="the-copper-supply-gap-in-one-snapshot"><a href="#the-copper-supply-gap-in-one-snapshot">#</a>The Copper Supply Gap In One Snapshot</h2><p>The chart shows three very different numbers. About 980 Mt of copper qualifies as reserves. Identified resources exceed 2,100 Mt. Total resources approach 5,600 Mt.</p><p>Only reserves are economic to extract under current prices and mining conditions. Identified resources have been discovered and drilled, but include material that may be marginal or uneconomic today. Total resources include both identified deposits and additional copper believed to exist based on geological evidence.</p><p>That gap between 980 Mt and 5,600 Mt is the core issue. Copper is geologically abundant. Economic copper is far more limited. For investors, that distinction shapes long-term pricing power and equity performance.</p><h2 id="supply-looks-large-but-it-is-price-sensitive"><a href="#supply-looks-large-but-it-is-price-sensitive">#</a>Supply Looks Large But It Is Price Sensitive</h2><p>At 23 Mt per year, global mine production is small relative to what sits in the ground. That creates a false sense of comfort. Most of the 5,600 Mt estimated resource base is lower grade, deeper, or located in challenging jurisdictions.</p><p>When copper prices fall, companies cut exploration budgets and delay expansion projects. Reserves can shrink as marginal deposits become uneconomic. When prices rise, the opposite occurs. More projects move into the reserve category.</p><p>Copper supply expands when prices justify investment and shrinks when they do not. Developing new mines requires exploration, feasibility studies, permitting, and construction, a process that can take a decade or more.</p><p>For retail investors, sustained investment in new supply historically requires prices high enough to justify development. Otherwise, supply growth slows over time.</p><p>Demand is the other side of the equation.</p><p>Global electrification trends increase copper use in vehicles, grids, data centres, and renewable infrastructure.</p><p>Copper is not running out. The earth holds substantial quantities. But the portion that is economic today is far smaller than the headline resource number suggests. That distinction underpins long-term copper pricing.</p><h2 id="what-this-means-for-copper-mining-stocks"><a href="#what-this-means-for-copper-mining-stocks">#</a>What This Means For Copper Mining Stocks</h2><p>For the sector overall, the structure supports a constructive long-term outlook, assuming sustained demand and disciplined capital allocation. Large resource estimates do not cap prices because most of that copper is not economic today. Long development timelines prevent a quick supply response. Electrification in vehicles, grids, and renewable energy systems adds steady demand pressure.</p><h2 id="structural-tightness-does-not-mean-imminent-shortages"><a href="#structural-tightness-does-not-mean-imminent-shortages">#</a>Structural Tightness Does Not Mean Imminent Shortages</h2><p>This data does not imply immediate scarcity. It does not guarantee short-term price spikes. And it does not mean every copper junior will succeed.</p><p>It supports a thesis of gradual structural tightness. Over time, maintaining supply requires higher incentive prices to convert resources into reserves.</p><p>For a retail investor, the edge comes from focusing on reserve quality, cost structure, and jurisdictional risk. Copper’s long-term outlook depends on price-enabled supply. That dynamic favors disciplined producers with durable assets, not marginal projects dependent on perfect conditions.</p><p>Against this backdrop, exploration companies play a necessary role in the copper supply chain. If reserves are the foundation of future production, they must first be discovered, defined, and advanced through the resource stage. Companies advancing drill programs in established mineral belts operate at the front end of that reserve replacement pipeline. In a market where long-term supply growth requires ongoing investment and new discoveries, disciplined exploration in prospective jurisdictions represents an early-stage entry point into the reserve replacement cycle that underpins the broader copper thesis.</p><h2 id="canterra-launches-fully-funded-2026-drill-program-in-newfoundland"><a href="#canterra-launches-fully-funded-2026-drill-program-in-newfoundland">#</a>Canterra Launches Fully Funded 2026 Drill Program in Newfoundland</h2><p><strong>Canterra Minerals Corp. (TSX-V: CTM) (OTCQB: CTMCF)</strong>, a diversified exploration company focused on discovering tier-one copper and gold deposits in the central Newfoundland mining district,<strong> </strong>recently <a href="https://www.valuethemarkets.com/news/press-releases/canterra-launches-fully-funded-15000-metre-discovery-focused-drill-program-in-newfoundland?utm_source&#61;ids&amp;utm_medium&#61;website&amp;utm_campaign&#61;cm004&amp;utm_id&#61;ids1m02" target="_blank" rel="noopener noreferrer nofollow"><u>announced its fully funded 2026 15,000m</u></a> drill campaign across its 100%-owned projects in central Newfoundland.</p><p>The company has uniquely consolidated most of the known copper-gold mineralization in this prolific but historically fragmented region. Its projects are located near historic mines that produced copper, zinc, lead, silver, and gold. Its gold assets lie along a 55 km trend connected to Equinox Gold’s Valentine Mine. Canterra’s position in this emerging district places it early in the exploration cycle, as Newfoundland experiences renewed interest driven by recent high-grade gold discoveries.</p><p>Canterra’s 2026 drill campaign includes up to 15,000 metres of diamond drilling split equally across Buchans, the Victoria Lake Supergroup portfolio and Wilding. Its 2,000m winter program at Buchans has already begun following <a href="https://www.valuethemarkets.com/analysis/canterras-latest-copper-drill-expands-newfoundland-resource?utm_source&#61;ids&amp;utm_medium&#61;website&amp;utm_campaign&#61;cm004&amp;utm_id&#61;ids1m02" target="_blank" rel="noopener noreferrer nofollow"><u>high-grade copper results</u> </a>from Phase 3 discovery drilling reported in November 2025, and <a href="https://www.valuethemarkets.com/analysis/canterra-intersects-high-grade-copper-gold-at-clementine-near-buchans?utm_source&#61;ids&amp;utm_medium&#61;website&amp;utm_campaign&#61;cm004&amp;utm_id&#61;ids1m02" target="_blank" rel="noopener noreferrer nofollow"><u>high-grade copper intercepts</u></a> at the Clementine target in September 2025.</p><p>Chris Pennimpede, President and CEO of Canterra, commented: </p><blockquote><p><em>2026 marks the beginning of a true discovery-driven phase for Canterra. At Buchans, winter drilling is already underway as we apply modern deep-seeking geophysics to one of the world’s most prolific high-grade VMS districts and systematically test targets that previous operators could not effectively evaluate at depth.</em></p><p><em>In parallel, we are advancing our Wilding Gold Project along the same structural corridor that hosts the producing Valentine Mine, where we control a 55 kilometre extension of this gold-bearing trend. Our Q1–Q2 program is designed to refine and prioritize targets ahead of diamond drilling in the second half of the year.</em></p><p><em>With a fully funded 15,000 metre program and successive drill results anticipated throughout 2026, we believe we are positioned to demonstrate the broader district-scale potential of our Newfoundland land package.</em></p></blockquote><h3 id="learn-more-about-canterra-minerals-exploration-activities"><a href="#learn-more-about-canterra-minerals-exploration-activities">#</a><a href="https://www.valuethemarkets.com/analysis/market-reports-guides/reports/fully-funded-copper-gold-explorer-backed-by-experienced-investors?utm_source&#61;ids&amp;utm_medium&#61;website&amp;utm_campaign&#61;cm004&amp;utm_id&#61;ids1m02&amp;utm_content&#61;final" target="_blank" rel="noopener noreferrer nofollow"><strong>Learn more about Canterra Minerals’ exploration activities →</strong></a></h3>
                ]]>
            </content>
                                                <category term="Investing Data Stories" />
            
            <published>2026-03-24T09:05:47+00:00</published>
            <updated>2026-03-24T15:11:50+00:00</updated>
        </entry>
            <entry>
            <title><![CDATA[Ranked: Where Exploration Approvals Move Fastest]]></title>
            <link rel="alternate" href="https://www.valuethemarkets.com/investing-data-story/ranked-where-exploration-approvals-move-fastest" />
            <id>https://www.valuethemarkets.com/19901</id>
            <author>
                <name><![CDATA[Mark Sheridan]]></name>
                        <email><![CDATA[marksheridan1000@googlemail.com]]></email>
                    </author>
            <summary type="html">
                <![CDATA[With 86% of exploration permits approved in 2 months or less, Newfoundland ranks as one of the fastest permitting jurisdictions surveyed globally.]]>
            </summary>
                        <content type="html">
                <![CDATA[
                                        <p><a href="https://www.valuethemarkets.com/investing-data-story/ranked-where-exploration-approvals-move-fastest"><img alt="Ranked: Where Exploration Approvals Move Fastest" src="https://www.valuethemarkets.com/curator/media/9a2caea9-cb9c-40fe-bbb9-96c98560c075.jpg?fm=webp&amp;q=80&amp;s=81c7989b6679ba5bf7a7d6beb07a103d" /></a></p>
                                        <div>
                    <a href="https://www.valuethemarkets.com/analysis/market-reports-guides/reports/fully-funded-copper-gold-explorer-backed-by-experienced-investors?utm_source&#61;website&amp;utm_medium&#61;ids1&amp;utm_campaign&#61;cm004&amp;utm_content&#61;graphic" rel="noopener noreferrer">
            <figure class>
                                    <img src="/curator/media/dc585a1c-d524-452e-a8a1-f5fac105b87a.jpg?fm&#61;webp&amp;q&#61;80&amp;s&#61;0948ef26400a310258468d5847afa045" alt="Where Exploration Approvals Move Fastest - Value The Markets Investing Data Story" width="1200" height="1500" />
                                                   </figure>
            </a>
            </div>
<p><strong><small>Sponsored by: Canterra Minerals. </small></strong><small>With active drill programs, multiple emerging targets, and recent discoveries, Canterra is advancing a portfolio of copper and gold assets in central Newfoundland.<strong> </strong><a href="https://www.valuethemarkets.com/analysis/market-reports-guides/reports/fully-funded-copper-gold-explorer-backed-by-experienced-investors?utm_source&#61;website&amp;utm_medium&#61;ids1&amp;utm_campaign&#61;cm004&amp;utm_content&#61;top">Access our Exclusive Investor Report on Canterra Minerals.</a></small></p><h2 id="newfoundland-tops-the-list-for-fastest-exploration-permits"><a href="#newfoundland-tops-the-list-for-fastest-exploration-permits">#</a>Newfoundland Tops the List for Fastest Exploration Permits</h2><p>For retail investors tracking mining and exploration stocks, permit timelines matter. Delays in regulatory approvals can stall projects, inflate costs, and erode shareholder confidence. So when a region like Newfoundland stands out with fast and predictable permitting, it becomes an important signal.</p><p>According to the latest data from the Fraser Institute’s Annual Survey of Mining Companies, 86% of respondents said they secured exploration permits in Newfoundland and Labrador within 2 months. That’s not just the best performance in Canada but no other jurisdiction came close to this level of efficiency. In a sector where time is capital, this speed offers companies and investors a clear advantage.</p><p>Faster, predictable permitting improves project timelines and capital efficiency for exploration companies operating in fast-permitting zones like Newfoundland.</p><p>This can have direct financial implications. Faster permitting allows for quicker mobilization, reduced holding costs, and a better ability to capitalize on commodity cycles. For investors seeking predictability and momentum in mining exposure, jurisdictions that move efficiently stand out.</p><table><tbody><tr><td rowspan="1" colspan="1"><strong>Region</strong></td><td rowspan="1" colspan="1"><strong>2 months or less</strong></td><td rowspan="1" colspan="1"><strong>3 to 6 months</strong></td><td rowspan="1" colspan="1"><strong>7 to 10 months</strong></td><td rowspan="1" colspan="1"><strong>11 to 14 months</strong></td><td rowspan="1" colspan="1"><strong>15 to 18 months</strong></td><td rowspan="1" colspan="1"><strong>19 to 23 months</strong></td><td rowspan="1" colspan="1"><strong>24 months or more</strong></td></tr><tr><td rowspan="1" colspan="1">Newfoundland &amp; Labrador*</td><td rowspan="1" colspan="1">86%</td><td rowspan="1" colspan="1">0%</td><td rowspan="1" colspan="1">0%</td><td rowspan="1" colspan="1">0%</td><td rowspan="1" colspan="1">0%</td><td rowspan="1" colspan="1">14%</td><td rowspan="1" colspan="1">0%</td></tr><tr><td rowspan="1" colspan="1">Utah*</td><td rowspan="1" colspan="1">60%</td><td rowspan="1" colspan="1">20%</td><td rowspan="1" colspan="1">0%</td><td rowspan="1" colspan="1">20%</td><td rowspan="1" colspan="1">0%</td><td rowspan="1" colspan="1">0%</td><td rowspan="1" colspan="1">0%</td></tr><tr><td rowspan="1" colspan="1">Saskatchewan*</td><td rowspan="1" colspan="1">56%</td><td rowspan="1" colspan="1">33%</td><td rowspan="1" colspan="1">0%</td><td rowspan="1" colspan="1">0%</td><td rowspan="1" colspan="1">0%</td><td rowspan="1" colspan="1">0%</td><td rowspan="1" colspan="1">11%</td></tr><tr><td rowspan="1" colspan="1">Alaska*</td><td rowspan="1" colspan="1">43%</td><td rowspan="1" colspan="1">43%</td><td rowspan="1" colspan="1">0%</td><td rowspan="1" colspan="1">14%</td><td rowspan="1" colspan="1">0%</td><td rowspan="1" colspan="1">0%</td><td rowspan="1" colspan="1">0%</td></tr><tr><td rowspan="1" colspan="1">Quebec</td><td rowspan="1" colspan="1">33%</td><td rowspan="1" colspan="1">13%</td><td rowspan="1" colspan="1">13%</td><td rowspan="1" colspan="1">7%</td><td rowspan="1" colspan="1">20%</td><td rowspan="1" colspan="1">7%</td><td rowspan="1" colspan="1">7%</td></tr><tr><td rowspan="1" colspan="1">Nevada</td><td rowspan="1" colspan="1">31%</td><td rowspan="1" colspan="1">23%</td><td rowspan="1" colspan="1">0%</td><td rowspan="1" colspan="1">8%</td><td rowspan="1" colspan="1">8%</td><td rowspan="1" colspan="1">0%</td><td rowspan="1" colspan="1">31%</td></tr><tr><td rowspan="1" colspan="1">Nova Scotia</td><td rowspan="1" colspan="1">30%</td><td rowspan="1" colspan="1">10%</td><td rowspan="1" colspan="1">0%</td><td rowspan="1" colspan="1">10%</td><td rowspan="1" colspan="1">20%</td><td rowspan="1" colspan="1">0%</td><td rowspan="1" colspan="1">30%</td></tr><tr><td rowspan="1" colspan="1">New South Wales*</td><td rowspan="1" colspan="1">29%</td><td rowspan="1" colspan="1">0%</td><td rowspan="1" colspan="1">29%</td><td rowspan="1" colspan="1">14%</td><td rowspan="1" colspan="1">0%</td><td rowspan="1" colspan="1">14%</td><td rowspan="1" colspan="1">14%</td></tr><tr><td rowspan="1" colspan="1">Ontario</td><td rowspan="1" colspan="1">27%</td><td rowspan="1" colspan="1">20%</td><td rowspan="1" colspan="1">0%</td><td rowspan="1" colspan="1">7%</td><td rowspan="1" colspan="1">13%</td><td rowspan="1" colspan="1">20%</td><td rowspan="1" colspan="1">13%</td></tr><tr><td rowspan="1" colspan="1">Western Australia</td><td rowspan="1" colspan="1">27%</td><td rowspan="1" colspan="1">20%</td><td rowspan="1" colspan="1">20%</td><td rowspan="1" colspan="1">20%</td><td rowspan="1" colspan="1">7%</td><td rowspan="1" colspan="1">0%</td><td rowspan="1" colspan="1">7%</td></tr><tr><td rowspan="1" colspan="1">Sweden</td><td rowspan="1" colspan="1">22%</td><td rowspan="1" colspan="1">50%</td><td rowspan="1" colspan="1">28%</td><td rowspan="1" colspan="1">0%</td><td rowspan="1" colspan="1">0%</td><td rowspan="1" colspan="1">0%</td><td rowspan="1" colspan="1">0%</td></tr><tr><td rowspan="1" colspan="1">Victoria*</td><td rowspan="1" colspan="1">20%</td><td rowspan="1" colspan="1">0%</td><td rowspan="1" colspan="1">20%</td><td rowspan="1" colspan="1">20%</td><td rowspan="1" colspan="1">0%</td><td rowspan="1" colspan="1">40%</td><td rowspan="1" colspan="1">0%</td></tr><tr><td rowspan="1" colspan="1">Nunavut*</td><td rowspan="1" colspan="1">17%</td><td rowspan="1" colspan="1">0%</td><td rowspan="1" colspan="1">33%</td><td rowspan="1" colspan="1">33%</td><td rowspan="1" colspan="1">0%</td><td rowspan="1" colspan="1">17%</td><td rowspan="1" colspan="1">0%</td></tr><tr><td rowspan="1" colspan="1">South Australia</td><td rowspan="1" colspan="1">16%</td><td rowspan="1" colspan="1">42%</td><td rowspan="1" colspan="1">16%</td><td rowspan="1" colspan="1">11%</td><td rowspan="1" colspan="1">5%</td><td rowspan="1" colspan="1">5%</td><td rowspan="1" colspan="1">5%</td></tr><tr><td rowspan="1" colspan="1">Queensland*</td><td rowspan="1" colspan="1">13%</td><td rowspan="1" colspan="1">25%</td><td rowspan="1" colspan="1">13%</td><td rowspan="1" colspan="1">13%</td><td rowspan="1" colspan="1">25%</td><td rowspan="1" colspan="1">0%</td><td rowspan="1" colspan="1">13%</td></tr><tr><td rowspan="1" colspan="1">Manitoba*</td><td rowspan="1" colspan="1">11%</td><td rowspan="1" colspan="1">33%</td><td rowspan="1" colspan="1">11%</td><td rowspan="1" colspan="1">0%</td><td rowspan="1" colspan="1">11%</td><td rowspan="1" colspan="1">22%</td><td rowspan="1" colspan="1">11%</td></tr><tr><td rowspan="1" colspan="1">Finland*</td><td rowspan="1" colspan="1">11%</td><td rowspan="1" colspan="1">11%</td><td rowspan="1" colspan="1">56%</td><td rowspan="1" colspan="1">11%</td><td rowspan="1" colspan="1">0%</td><td rowspan="1" colspan="1">0%</td><td rowspan="1" colspan="1">11%</td></tr><tr><td rowspan="1" colspan="1">Northern Territory</td><td rowspan="1" colspan="1">9%</td><td rowspan="1" colspan="1">36%</td><td rowspan="1" colspan="1">9%</td><td rowspan="1" colspan="1">9%</td><td rowspan="1" colspan="1">18%</td><td rowspan="1" colspan="1">0%</td><td rowspan="1" colspan="1">18%</td></tr><tr><td rowspan="1" colspan="1">British Columbia</td><td rowspan="1" colspan="1">7%</td><td rowspan="1" colspan="1">57%</td><td rowspan="1" colspan="1">7%</td><td rowspan="1" colspan="1">21%</td><td rowspan="1" colspan="1">7%</td><td rowspan="1" colspan="1">0%</td><td rowspan="1" colspan="1">0%</td></tr><tr><td rowspan="1" colspan="1">Northwest Territories*</td><td rowspan="1" colspan="1">0%</td><td rowspan="1" colspan="1">20%</td><td rowspan="1" colspan="1">40%</td><td rowspan="1" colspan="1">20%</td><td rowspan="1" colspan="1">0%</td><td rowspan="1" colspan="1">0%</td><td rowspan="1" colspan="1">20%</td></tr><tr><td rowspan="1" colspan="1">Yukon*</td><td rowspan="1" colspan="1">0%</td><td rowspan="1" colspan="1">0%</td><td rowspan="1" colspan="1">25%</td><td rowspan="1" colspan="1">50%</td><td rowspan="1" colspan="1">13%</td><td rowspan="1" colspan="1">13%</td><td rowspan="1" colspan="1">0%</td></tr><tr><td rowspan="1" colspan="2">*Between 5 &amp; 9 responses</td><td rowspan="1" colspan="1"></td><td rowspan="1" colspan="1"></td><td rowspan="1" colspan="1"></td><td rowspan="1" colspan="1"></td><td rowspan="1" colspan="1"></td><td rowspan="1" colspan="1"></td></tr></tbody></table><p><strong>Source: </strong>The Fraser Institute’s Annual Survey of Mining Companies 2024</p><h2 id="why-permit-speed-matters-for-retail-investors"><a href="#why-permit-speed-matters-for-retail-investors">#</a>Why Permit Speed Matters for Retail Investors</h2><ul><li><strong>Reduces Project Risk:</strong> Faster permitting lowers the likelihood of delays and limits the amount of capital tied up in regulatory uncertainty, supporting more predictable project execution.</li><li><strong>Improves Capital Efficiency: </strong>Shorter approval timelines reduce holding and overhead costs, allowing more capital to be directed toward exploration activity rather than administration.</li><li><strong>Accelerates Value Creation: </strong>Companies can reach drilling, resource definition, and other key milestones sooner, which often leads to earlier news flow and potential market re-rating.</li><li><strong>Extends Runway for Junior Miners: </strong>Lower carrying costs help conserve cash, giving early-stage companies more flexibility to advance projects without frequent dilution.</li><li><strong>Enhances Strategic Appeal: </strong>Jurisdictions with reliable permitting timelines are more attractive to major miners and joint-venture partners, increasing the strategic value of local exploration assets.</li></ul><p>Find out why jurisdiction is becoming a critical factor when permitting slows.</p><h2 id="canada-is-a-global-mining-powerhouse"><a href="#canada-is-a-global-mining-powerhouse">#</a>Canada is a Global Mining Powerhouse</h2><p>Canada continues to demonstrate why it is considered one of the most mining-friendly regions globally. The survey also shows that Canadian jurisdictions like Saskatchewan and Newfoundland &amp; Labrador ranked in the global top 10 for overall investment attractiveness, which factors in both policy perception and mineral potential.</p><p>This strength lies not just in mineral richness but also in policy diversity. Retail investors benefit from this jurisdictional spread. For example, Newfoundland offers speed, Saskatchewan provides regulatory stability, and Ontario combines scale with mature infrastructure.</p><h2 id="comparing-global-permit-wait-times"><a href="#comparing-global-permit-wait-times">#</a>Comparing Global Permit Wait Times</h2><p>While Newfoundland leads the pack at 86% permitting within two months, other jurisdictions show broader ranges. For example:</p><ul><li><strong>Nevada</strong>: 31% of respondents reported permit timelines of two months or less, but another 31% cited wait times over 24 months.</li><li><strong>Ontario</strong>: 27% saw permits granted in two months, while 13% expected timelines exceeding 24 months.</li><li><strong>British Columbia</strong>: Though 57% expected permits within 3 to 6 months, only 7% said permits took two months or less.</li></ul><p>This spread matters. Retail investors should weigh not just geology but also operational momentum. Delays can affect company news flow, financing schedules, and ultimately share price movement.</p><h2 id="what-makes-newfoundland-stand-out"><a href="#what-makes-newfoundland-stand-out">#</a>What Makes Newfoundland Stand Out</h2><p>Speed is just one factor. Newfoundland &amp; Labrador also scored well on the Policy Perception Index, placing 6th globally. That signals strong confidence in its legal framework, regulatory transparency, and community engagement practices.</p><p>When a jurisdiction combines administrative speed with policy stability, it becomes an outlier worth paying attention to. It reduces both time risk and political risk, making it especially appealing for juniors looking to raise capital or larger companies needing reliable timelines.</p><p>This efficiency adds momentum to companies like Canterra Minerals, which just reported high-grade gold results from its Wilding Gold Project in central Newfoundland.</p><h2 id="canterra-launches-drilling-in-newfoundland-gold-belt"><a href="#canterra-launches-drilling-in-newfoundland-gold-belt">#</a>Canterra Launches Drilling in Newfoundland Gold Belt</h2><p><strong>Canterra Minerals Corp. (TSX-V: CTM) (OTCQB: CTMCF) </strong>recently reported <a href="https://www.valuethemarkets.com/analysis/high-grade-gold-reported-next-to-producing-mine">exceptional high-grade gold drill results</a> from its fall 2025 diamond drilling program at the 100%-owned Wilding Gold Project in central Newfoundland. The project is strategically located adjacent to Equinox Gold’s Valentine Mine, Atlantic Canada’s largest gold operation.</p><p>In fall 2025, the company drilled 1,243 m across 18 holes, focusing on the Elm and Alder Zones and testing Aspen, a new target area. The headline intercept of 31.5 metres averaging 10.89 g/t Au confirms the presence of a robust, high-grade quartz-sulphide vein system at the Elm Zone while the mineralized footprint at Alder and Aspen reinforces the interpretation of a district-scale hydrothermal gold system.</p><p>Chris Pennimpede, President and CEO of Canterra, commented:</p><p><em>“These results demonstrate that Wilding has the potential to host a high-grade, district-scale gold system in one of Canada’s most attractive mining jurisdictions. As global uncertainty continues to drive interest in secure North American gold assets, we believe Canterra is well positioned to create long-term value through disciplined exploration next door to Atlantic Canada’s largest gold producer.”</em></p><p><a href="https://www.valuethemarkets.com/analysis/market-reports-guides/reports/fully-funded-copper-gold-explorer-backed-by-experienced-investors?utm_source&#61;website&amp;utm_medium&#61;ids1&amp;utm_campaign&#61;cm004&amp;utm_content&#61;middle"><strong>Learn more about Canterra Minerals’ exploration activities →</strong></a></p><p><strong>Latest Drilling Campaign Highlights Include:</strong></p><ul><li><strong>Exceptional high-grade gold intercepts at Wilding</strong>, including <strong>10.89 g/t Au over 31.5 metres core length</strong>, with <strong>41.0 g/t Au over 5.4 metres</strong>, from 59.0 metres depth in hole WL-25-100 at the Elm Zone. Results were reported <a href="https://www.valuethemarkets.com/news/press-releases/canterra-minerals-intersects-high-grade-gold-at-wilding-in-central-newfoundland-including-1089-gt-au-over-315-m">January 21, 2026</a>, following previously reported <a href="https://www.valuethemarkets.com/analysis/exceptional-gold-grades-reported-in-newfoundland-project">record samples of up to 535 g/t Au</a>.<br /></li><li><strong>Shallow near-surface gold mineralization confirmed</strong>, highlighted by <strong>6.16 g/t Au over 4.1 metres</strong> from 5.1 metres depth, including <strong>20.96 g/t Au over 1 metre</strong>, in hole WL-25-95 at the Alder Zone.<br /></li><li><strong>Elm Zone now interpreted as a large, coherent gold corridor</strong>, approximately 300 metres along strike by 100 metres down dip, demonstrating meaningful scale, continuity, and future resource potential.<br /></li><li><strong>Drilling confirms continuity of high-grade quartz-sulphide gold veins</strong>, with broad alteration halos pointing to a larger and more robust hydrothermal system at Wilding.<br /></li><li><strong>Successful first-pass drilling at the new Aspen Target</strong>, returning anomalous gold values up to 0.57 g/t Au in hole WL-25-99, expanding the known footprint of mineralized veining.<br /></li><li><strong>Additional exploration success at Buchans</strong>, where Canterra reported <a href="https://www.valuethemarkets.com/analysis/canterras-latest-copper-drill-expands-newfoundland-resource">high-grade copper results</a> from Phase 3 discovery drilling reported November 19, 2025, following <a href="https://www.valuethemarkets.com/analysis/canterra-intersects-high-grade-copper-gold-at-clementine-near-buchans">high-grade copper intercepts</a> at the Clementine target announced September 23, 2025.</li></ul><p>With active drill programs, multiple emerging targets, and recent discoveries, Canterra is advancing a portfolio of copper and gold assets in central Newfoundland.</p><p>Canterra’s position in this emerging district places it early in the exploration cycle, as Newfoundland experiences renewed interest driven by recent high-grade gold discoveries. With backing from known mineral investors Eric Sprott and Michael Gentile, Canterra Minerals is consolidating Newfoundland’s copper-gold potential.</p><p><a href="https://www.valuethemarkets.com/analysis/market-reports-guides/reports/fully-funded-copper-gold-explorer-backed-by-experienced-investors?utm_source&#61;website&amp;utm_medium&#61;ids1&amp;utm_campaign&#61;cm004&amp;utm_content&#61;middle"><strong>Get An Exclusive Investor Report</strong></a></p>
                ]]>
            </content>
                                                <category term="Investing Data Stories" />
            
            <published>2026-02-19T16:45:54+00:00</published>
            <updated>2026-03-16T04:52:10+00:00</updated>
        </entry>
            <entry>
            <title><![CDATA[10 Stocks With the Fastest Revenue Growth]]></title>
            <link rel="alternate" href="https://www.valuethemarkets.com/investing-data-story/10-stocks-with-the-fastest-revenue-growth" />
            <id>https://www.valuethemarkets.com/19155</id>
            <author>
                <name><![CDATA[Kirsteen Mackay]]></name>
                        <email><![CDATA[kirsteen.mackay@digitonic.co.uk]]></email>
                    </author>
            <summary type="html">
                <![CDATA[These companies, including NVIDIA and Coinbase, posted impressive revenue growth—over 100% in some cases—highlighting strong sector momentum.]]>
            </summary>
                        <content type="html">
                <![CDATA[
                                        <p><a href="https://www.valuethemarkets.com/investing-data-story/10-stocks-with-the-fastest-revenue-growth"><img alt="10 Stocks With the Fastest Revenue Growth" src="https://www.valuethemarkets.com/curator/media/the-10-fastest-growing-stocks-right-now-infographic-featured-image-1.jpg?fm=webp&amp;q=80&amp;s=d6fec019d108a944b70375ddcb09cb43" /></a></p>
                                        <p><img src="https://fls-a1a48689-24ff-4de2-98f3-ba3e44ca0139.laravel.cloud/media/the-10-fastest-growing-stocks-right-now-infographic-1.jpg" alt="The 10 Fastest-Growing Stocks Right Now_Infographic (1)" title="The 10 Fastest-Growing Stocks Right Now_Infographic (1)" width="1200" style="width: 1200; height: 1500;" height="1500" /></p><h2 id="top-stocks-with-rapid-revenue-growth-in-the-past-year"><a href="#top-stocks-with-rapid-revenue-growth-in-the-past-year">#</a>Top Stocks With Rapid Revenue Growth in the Past Year</h2><p>The fastest-growing companies by revenue over the past year reveal a clear trend: tech and financials are leading the charge. To be included in our ranking, a company needed at least $1 billion in trailing 12-month (TTM) revenue. The top 10 features well-known names like <a data-type="mention" data-id="4413" href="https://www.valuethemarkets.com/market/stocks/nasdaq-nvda">&#64;Nvidia Corp (NASDAQ:NVDA)</a> and <a data-type="mention" data-id="1614" href="https://www.valuethemarkets.com/market/stocks/nasdaq-coin">&#64;Coinbase Global Inc Cl A (NASDAQ:COIN)</a>, along with rising players such as Galaxy Digital and Super Micro Computer.</p><p>These businesses are not just expanding; they are growing at an impressive pace. Revenue growth on this list ranges from 43% to over 110%, with some showing multi-year consistency. For retail investors, this level of growth may highlight companies in expansion mode, gaining market share, or benefiting from long-term themes such as AI, crypto, and digital infrastructure.</p><h2 id="why-revenue-growth-matters-for-retail-investors"><a href="#why-revenue-growth-matters-for-retail-investors">#</a>Why Revenue Growth Matters for Retail Investors</h2><ul><li>High revenue growth can indicate a company is gaining market traction or benefiting from broader economic or technology trends.</li><li>Strong sales performance may lead to improved earnings over time, potentially enhancing shareholder value.</li><li>Rapidly growing firms can attract increased attention from institutional investors, which may impact stock performance.</li><li><p>Tracking revenue trends can help investors identify emerging opportunities or shifts in sector strength.</p></li></ul><table><tbody><tr><th rowspan="1" colspan="1">Ticker</th><th rowspan="1" colspan="1">Name</th><th rowspan="1" colspan="1">Revenue Growth<br />(TTM, %)</th><th rowspan="1" colspan="1">GICS Sector</th><th rowspan="1" colspan="1">Revenue (TTM, $)</th></tr><tr><td rowspan="1" colspan="1">NVDA</td><td rowspan="1" colspan="1">Nvidia Corp</td><td rowspan="1" colspan="1">114.2%</td><td rowspan="1" colspan="1">Information Technology</td><td rowspan="1" colspan="1">$187B</td></tr><tr><td rowspan="1" colspan="1">COIN</td><td rowspan="1" colspan="1">Coinbase Global Inc</td><td rowspan="1" colspan="1">111.1%</td><td rowspan="1" colspan="1">Financials</td><td rowspan="1" colspan="1">$7.7B</td></tr><tr><td rowspan="1" colspan="1">GLXY</td><td rowspan="1" colspan="1">Galaxy Digital Inc</td><td rowspan="1" colspan="1">88.1%</td><td rowspan="1" colspan="1">Financials</td><td rowspan="1" colspan="1">$51.7B</td></tr><tr><td rowspan="1" colspan="1">IMG</td><td rowspan="1" colspan="1">Iamgold Corp</td><td rowspan="1" colspan="1">65.4%</td><td rowspan="1" colspan="1">Materials</td><td rowspan="1" colspan="1">$2.2B</td></tr><tr><td rowspan="1" colspan="1">PR</td><td rowspan="1" colspan="1">Permian Resources Corp</td><td rowspan="1" colspan="1">58.8%</td><td rowspan="1" colspan="1">Energy</td><td rowspan="1" colspan="1">$5.3B</td></tr><tr><td rowspan="1" colspan="1">HOOD</td><td rowspan="1" colspan="1">Robinhood Markets Inc</td><td rowspan="1" colspan="1">58.2%</td><td rowspan="1" colspan="1">Financials</td><td rowspan="1" colspan="1">$4.2B</td></tr><tr><td rowspan="1" colspan="1">NEM</td><td rowspan="1" colspan="1">Newmont Corp</td><td rowspan="1" colspan="1">58.2%</td><td rowspan="1" colspan="1">Materials</td><td rowspan="1" colspan="1">$21.5B</td></tr><tr><td rowspan="1" colspan="1">MU</td><td rowspan="1" colspan="1">Micron Technology Inc</td><td rowspan="1" colspan="1">48.8%</td><td rowspan="1" colspan="1">Information Technology</td><td rowspan="1" colspan="1">$42.3B</td></tr><tr><td rowspan="1" colspan="1">SMCI</td><td rowspan="1" colspan="1">Super Micro Computer Inc</td><td rowspan="1" colspan="1">46.6%</td><td rowspan="1" colspan="1">Information Technology</td><td rowspan="1" colspan="1">$21.1B</td></tr><tr><td rowspan="1" colspan="1">NU</td><td rowspan="1" colspan="1">Nu Holdings Ltd</td><td rowspan="1" colspan="1">43.4%</td><td rowspan="1" colspan="1">Financials</td><td rowspan="1" colspan="1">$14.1B</td></tr></tbody></table><p><strong><small>Source: </small></strong><small>Bloomberg. Revenue growth based on reported trailing-12-month sales. | TTM &#61; Trailing 12 Months</small></p><h2 id="nvidia-and-coinbase-at-the-top"><a href="#nvidia-and-coinbase-at-the-top">#</a>NVIDIA and Coinbase at the Top</h2><p>NVIDIA leads with 114% revenue growth, driven by increased demand for AI semiconductors. With $187 billion in TTM revenue and a market cap above $4.5 trillion, NVIDIA demonstrates that large companies can still deliver substantial growth when positioned in high-demand sectors.</p><p>Coinbase follows with 111% growth. This performance is notable in a volatile sector like crypto. With $7.6 billion in revenue and a $58 billion market cap, Coinbase appears to be benefiting from renewed interest in digital assets.</p><h2 id="galaxy-digital-and-robinhood-in-the-spotlight"><a href="#galaxy-digital-and-robinhood-in-the-spotlight">#</a>Galaxy Digital and Robinhood in the Spotlight</h2><p>Galaxy Digital posted 88% growth, reflecting broad exposure to blockchain, asset management, and trading. The company remains in the spotlight with several strategic moves, most notably preparing a US$100 million hedge fund aiming to profit from crypto and fintech volatility early in 2026. The firm also secured approval to significantly expand power capacity at its Texas Helios data center, bolstering its AI and infrastructure capabilities.</p><p>Robinhood showed 58% TTM revenue growth, likely supported by increased user engagement and expanding product offerings. Its role in mobile-first trading and exposure to digital assets may continue to influence its revenue trajectory.</p><h2 id="notable-growth-across-energy-materials-and-tech"><a href="#notable-growth-across-energy-materials-and-tech">#</a>Notable Growth Across Energy, Materials, and Tech</h2><p>Permian Resources reported 59% growth, benefiting from a favorable energy environment and disciplined operations.</p><p>Micron Technology, up 49%, is tied to rising demand for memory in data-intensive applications. Super Micro Computer gained 47% as demand for AI-related server infrastructure increased.</p><p>IAMGOLD and Newmont also posted strong numbers, showing that companies in materials and mining can achieve notable gains under supportive market conditions.</p><h2 id="faqs"><a href="#faqs">#</a>FAQs</h2><h3 id="what-does-ttm-revenue-mean"><a href="#what-does-ttm-revenue-mean">#</a>What does TTM revenue mean?</h3><p>TTM stands for trailing 12 months. It represents the revenue a company earned over the most recent four quarters.</p><h3 id="why-is-revenue-growth-important-for-stock-investing"><a href="#why-is-revenue-growth-important-for-stock-investing">#</a>Why is revenue growth important for stock investing?</h3><p>It reflects whether a company is expanding its operations. Consistent revenue growth may support future earnings and valuation increases.</p><h3 id="is-revenue-growth-more-important-than-profit"><a href="#is-revenue-growth-more-important-than-profit">#</a>Is revenue growth more important than profit?</h3><p>In early-stage or fast-expanding companies, revenue growth can be a key performance indicator. Over time, profitability and margin stability become more critical.</p><h3 id="how-can-i-find-high-growth-stocks"><a href="#how-can-i-find-high-growth-stocks">#</a>How can I find high-growth stocks?</h3><p>Investors can look for companies with strong sales growth, rising volume, and positive sector dynamics. Using financial tools or screeners can assist in this process.</p><h3 id="are-high-growth-stocks-risky"><a href="#are-high-growth-stocks-risky">#</a>Are high-growth stocks risky?</h3><p>They can involve higher volatility. It is important to evaluate the business model, cash flow, and competitive position to assess risk appropriately.</p>
                ]]>
            </content>
                                                <category term="Investing Data Stories" />
            
            <published>2026-01-26T11:27:33+00:00</published>
            <updated>2026-03-16T04:52:07+00:00</updated>
        </entry>
            <entry>
            <title><![CDATA[The Exploding Connected TV (CTV) Opportunity in India]]></title>
            <link rel="alternate" href="https://www.valuethemarkets.com/investing-data-story/the-exploding-connected-tv-ctv-opportunity-in-india" />
            <id>https://www.valuethemarkets.com/18829</id>
            <author>
                <name><![CDATA[Patricia Miller]]></name>
                        <email><![CDATA[patricia.miller@digitonic.co.uk]]></email>
                    </author>
            <summary type="html">
                <![CDATA[Explore Connected TV growth in India, where personalized content and tech drive rich market opportunities for media, entertainment, and tech sector investors.]]>
            </summary>
                        <content type="html">
                <![CDATA[
                                        <p><a href="https://www.valuethemarkets.com/investing-data-story/the-exploding-connected-tv-ctv-opportunity-in-india"><img alt="The Exploding Connected TV (CTV) Opportunity in India" src="https://www.valuethemarkets.com/curator/media/qy003-connected-tv-opportunity-featured.jpg?fm=webp&amp;q=80&amp;s=8140812c0fe5f5dc1df24c704dcc5006" /></a></p>
                                        <div>
                <figure class>
                            <img src="/curator/media/vtm-infographic-connectedtv-india-1706028441.jpg?fm&#61;webp&amp;q&#61;80&amp;s&#61;2a966877435c8e35e246b5d423339543" alt="vtm-infographic-connectedtv-india-1706028441" width="1200" height="3612" />
                                        </figure>
    </div>
<p></p><p>The global Connected TV (CTV) market is expanding. Connected TV growth rates and viewership patterns vary across regions, including an impressive 47% year-on-year increase in India, reaching 70 million viewers. This is leading investors to look at the CTV market for opportunities to invest.</p><p>The following insights offer retail investors critical information, aiding in informed decision-making for investments in the media, entertainment, or technology sectors.</p><h2 id="what-is-connected-tv-ctv"><a href="#what-is-connected-tv-ctv">#</a>What is Connected TV (CTV)? </h2><p>CTV refers to any TV that can connect to the internet and access content beyond what is available via the normal offering of cable providers. This includes Smart TVs, devices like Roku, Amazon Fire TV Sticks, or Apple TV, gaming consoles like Xbox and PlayStation, and internet-enabled Blu-ray/DVD players. CTV offers viewers access to streaming content and allows internet-based advertising.</p><p>Following on from the streaming wars that saw Netflix battle with Amazon Prime, Disney Plus and many more entrants vying for viewer eyeballs, CTV has generated intense competition among tech giants and manufacturers to launch smart TVs and devices that blend hardware with revenue-driving software.</p><p>Companies like <strong>Sony</strong> (NYSE: SONY), <strong>Microsoft</strong> (NASDAQ: MSFT), and <strong>Roku</strong> (NASDAQ: ROKU) are key players in the Connected TV (CTV) hardware market, while open-source operating systems like Coolita are gaining traction in India, used by brands such as Panasonic and Thomson.</p><h2 id="evolving-viewer-preferences-and-the-rise-of-connected-tv"><a href="#evolving-viewer-preferences-and-the-rise-of-connected-tv">#</a>Evolving Viewer Preferences and the Rise of Connected TV</h2><p>With the shift from traditional TV to CTV, investors need to note the changing habits, preferences, and expectations of viewers, especially regarding content consumption and advertising.</p><p>The rise of Connected TV (CTV) brings personalized, interactive, and on-demand entertainment, enabling businesses like QYOU Media to establish a strong presence in the Indian entertainment sector.</p><p>Advertisers are adapting to this new landscape, crafting strategies that effectively reach and engage audiences on CTV platforms, which differ significantly from traditional linear TV. That’s because TV advertising has long been a hugely lucrative business tool, and now there is increasing scope for money-making and branding opportunities for all business sizes. TV ads are becoming more interactive and tailored, boosting conversion rates. With Connected TV (CTV), there are even more options to personalize these ads. </p><h2 id="the-connected-tv-advertising-evolution"><a href="#the-connected-tv-advertising-evolution">#</a>The Connected TV Advertising Evolution</h2><p>For instance, artificial Intelligence (AI) is revolutionizing CTV, with recommendation engines tailoring content and Automatic Content Recognition (ACR) identifying what&#039;s being watched. This is being further extended to TV advertising with precise targeting, real-time insights, programmatic ad-buying, content optimization and more.</p><p>The impact of television advertising on society and the continuously evolving branding opportunities it brings are remarkable. This data-driven TV era is reshaping viewing habits and is expected to dominate TV viewership and ad revenue growth.</p><p>Convenience attracts viewers to Connected TV (CTV), while advertisers are drawn by its addressability. Viewers often maintain multiple connections for flexibility and to accommodate different family members&#039; viewing preferences. According to a Finecast and Kantar study, despite having various options, 65% of survey respondents prefer Connected TV, including Smart TVs and internet-enabled devices, over the 35% who favor linear TV (Cable &#43; DTH).</p><h2 id="the-indian-market-consumer-behavior-and-brand-strategy"><a href="#the-indian-market-consumer-behavior-and-brand-strategy">#</a>The Indian Market: Consumer Behavior and Brand Strategy </h2><p>Meanwhile, consumer behavior and market trends in India point towards a growing preference for the personalized, on-demand content offered by Connected TV.</p><p>Indeed, consumers believe CTV ads strongly influence their buying decisions, with higher viewership than linear TV ads. Consumers prefer CTV because of its flexibility to suit their needs, a broader range of content options, and ease of searching for content. They value the flexibility to watch content at their convenience, the uninterrupted nature of content, and the presence of fewer ads.</p><table><tbody><tr><th rowspan="1" colspan="1"><p>Why Connected TV Outshines Linear</p></th><th rowspan="1" colspan="1"><p>CTV Audience</p></th><th rowspan="1" colspan="1"><p>Linear TV Audience</p></th></tr><tr><td rowspan="1" colspan="1"><p>Time-Flexible Viewing</p></td><td rowspan="1" colspan="1"><p>78%</p></td><td rowspan="1" colspan="1"><p>74%</p></td></tr><tr><td rowspan="1" colspan="1"><p>Personalized Viewing Suitability</p></td><td rowspan="1" colspan="1"><p>78%</p></td><td rowspan="1" colspan="1"><p>70%</p></td></tr><tr><td rowspan="1" colspan="1"><p>Wider Content Variety</p></td><td rowspan="1" colspan="1"><p>76%</p></td><td rowspan="1" colspan="1"><p>69%</p></td></tr><tr><td rowspan="1" colspan="1"><p>Simplified Content Search</p></td><td rowspan="1" colspan="1"><p>74%</p></td><td rowspan="1" colspan="1"><p>64%</p></td></tr><tr><td rowspan="1" colspan="1"><p>Continuous Viewing Experience</p></td><td rowspan="1" colspan="1"><p>51%</p></td><td rowspan="1" colspan="1"><p>58%</p></td></tr><tr><td rowspan="1" colspan="1"><p>Fewer Ad Interruptions</p></td><td rowspan="1" colspan="1"><p>46%</p></td><td rowspan="1" colspan="1"><p>58%</p></td></tr></tbody></table><p></p><p>On the other hand, brands such as Plum Cosmetics, <strong>Dell Technologies</strong> (NYSE: DELL), and IGP.com value CTV for its immersive, precisely targeted advertising, effectively reaching digital natives and global Non-Resident Indians, thus boosting their growth and engagement strategies. </p><p>India&#039;s Connected TV market is not just reshaping domestic media consumption but is also positioned to make a significant impact on international television markets.</p><h2 id="ctvs-role-in-the-global-marketing-landscape"><a href="#ctvs-role-in-the-global-marketing-landscape">#</a>CTV&#039;s Role in the Global Marketing Landscape</h2><p>Connected TV (CTV) provides the opportunity for viewer interaction and personalization, which offers huge potential to increase conversion rates. As television adapts, it remains a vital global marketing tool, building trust and offering unique opportunities to brands and viewers alike.</p><p>Complementing CTV is Addressable TV (AV) which allows advertisers to show tailored ads to different households even if they’re watching the same content.</p><p>Thus, advertiser interest in TV is at an all-time high, positioning India to emerge as the third-largest TV market worldwide by 2026. That’s because interactive advertising on Connected TV platforms allows brands to engage with Indian viewers more dynamically and personally.</p><p>Also, in India, Free Ad-Supported Television (FAST) platforms on Connected TV are becoming popular, merging traditional TV&#039;s broad reach with digital targeting capabilities. The rise of FAST caters to the Indian market&#039;s appetite for diverse and accessible content.</p><p>The future looks promising, with technological advancements like the evolving CTV landscape presenting lucrative opportunities for media and entertainment businesses, particularly small and medium-sized ones, by broadening the audience reach as viewers shift from traditional TV to CTV platforms.</p><h2 id="why-this-is-important-for-retail-investors"><a href="#why-this-is-important-for-retail-investors">#</a>Why This Is Important for Retail Investors</h2><p>India is fast becoming an attractive investment hub, with widespread growth fueled by rising incomes, improved internet connectivity, and widespread smart TV adoption. That’s why the investing opportunity in India’s Connected TV market is highly promising. As viewers shift from traditional TV to CTV, the move creates business opportunities in the entertainment sector.</p><p>One such business at the forefront of this considerable opportunity is <strong>QYOU Media Inc.</strong> (TSXV: QYOU) (OTCQB: QYOUF), a fast-growing creator-media company. QYOU’s expertise lies in producing, distributing, and monetizing content created by social media influencers and digital content creators while significantly expanding its Connected TV (CTV) distribution.</p><p>This strategic approach aligns with the tremendous potential that the Indian CTV market holds. As the number of CTV households continues to climb, QYOU is well-poised to cater to the evolving preferences of viewers. By offering a wide range of engaging content and harnessing the power of CTV, QYOU aims to be at the forefront of this transformative media landscape, shaping the future of entertainment in India.</p><p>This US-based stock holds significant potential as it aims to tap into India&#039;s tech-savvy population of 1.4 billion.</p><p>India is currently experiencing a rapid increase in internet and social media adoption, boasting the world&#039;s largest youth population, with over 650 million individuals under the age of 25 and 850 million under 35. With improving economic opportunities and educational prospects, India presents a fertile ground for digital engagement and growth.</p><p>All-in-all the global CTV market is thriving, driven by strong performance in the U.S., significant growth in India and Brazil, and considerable yearly gains in established markets like Europe, indicating a shift in consumer habits worldwide.</p>
                ]]>
            </content>
                                                <category term="Investing Data Stories" />
            
            <published>2024-01-29T00:00:00+00:00</published>
            <updated>2026-03-16T04:52:05+00:00</updated>
        </entry>
            <entry>
            <title><![CDATA[Where do US and Canada Import Salt From?]]></title>
            <link rel="alternate" href="https://www.valuethemarkets.com/investing-data-story/where-do-us-and-canada-import-salt-from" />
            <id>https://www.valuethemarkets.com/18828</id>
            <author>
                <name><![CDATA[Patrick Davis]]></name>
                        <email><![CDATA[naz.shamlian@digitonic.co.uk]]></email>
                    </author>
            <summary type="html">
                <![CDATA[North America imports a lot of salt. While imports meet industry demands, the region faces challenges, including high shipping costs and aging domestic mines.]]>
            </summary>
                        <content type="html">
                <![CDATA[
                                        <p><a href="https://www.valuethemarkets.com/investing-data-story/where-do-us-and-canada-import-salt-from"><img alt="Where do US and Canada Import Salt From?" src="https://www.valuethemarkets.com/curator/media/ig-where-do-us-canada-import-salt-from-featured5.jpg?fm=webp&amp;q=80&amp;s=f64d99e5a077664411d8238e2f56e5ca" /></a></p>
                                        <div>
                    <a href="https://www.valuethemarkets.com/analysis/market-reports-guides/reports/why-consider-investing-in-atlas-salt-stock?utm_source&#61;ig1&amp;utm_medium&#61;website&amp;utm_campaign&#61;as001&amp;utm_content&#61;infographic-image" rel="noopener noreferrer">
            <figure class>
                                    <img src="/curator/media/93f0af59-ac87-43fc-929d-64701d720304.jpg?fm&#61;webp&amp;q&#61;80&amp;s&#61;0378b52969f93c5eaa9ea3446fe610e5" alt="Treemap of US and Canada salt imports totaling $497.73M, led by Chile at $113.57M and others at $70.09M" width="3840" height="6186" />
                                                   </figure>
            </a>
            </div>
<p>The widespread demand for salt across North American industries has created a reliance on imports to maintain supply stability. With salt essential for winter road safety, industrial production, and food processing, sourcing this mineral from abroad has become a necessary component of North American supply chains. However, meeting these needs comes with unique challenges that underscore the significance of managing both domestic resources and international logistics effectively.</p><h2 id="the-scale-of-salt-imports-in-north-america"><a href="#the-scale-of-salt-imports-in-north-america">#</a>The Scale of Salt Imports in North America</h2><p>In 2022, the global trade of salt amounted to approximately $4.44 billion<sup>1</sup>. North America&#039;s reliance on imported salt is starkly evident, with substantial imports to meet various industrial, commercial, and residential needs. Approximately 25 million tonnes of de-icing salt is used annually on U.S. roads<sup>2</sup>, with much of this demand being met through imports from regions like Chile, Egypt, and Mexico. This high dependency on foreign salt is driven by the lack of economically viable alternatives for rock salt, which remains indispensable for road safety during winter months.</p><h2 id="salts-diverse-uses"><a href="#salts-diverse-uses">#</a>Salt’s Diverse Uses</h2><p>Salt has played a vital role in human history, serving both as a necessity and a commodity. The modern salt industry spans multiple sectors, each with unique demands and applications. Considerable demand lies in de-icing where salt is essential for maintaining safe, ice-free roads in winter. The chemical sector also relies heavily on salt, which is critical in industrial processes. Meanwhile, salt remains a dietary staple used in the food industry for preservation and flavoring. Other uses include water treatment, animal feed, and medical applications, though the latter forms a very small market segment. This varied demand highlights salt’s indispensability across industries.</p><h2 id="challenges-in-the-salt-supply-chain"><a href="#challenges-in-the-salt-supply-chain">#</a>Challenges in the Salt Supply Chain</h2><p>The North American salt import market faces several pressing challenges:</p><ul><li><p><strong>High Overseas Shipping Costs: </strong>As global shipping costs are volatile, especially during challenging geopolitical times, this can make forecasting import costs difficult. This volatility in global shipping costs complicates budgeting and financial planning for businesses involved in imports. When shipping costs rise, the expense of importing salt will also rise, impacting overall cost and supply chain efficiency.</p></li><li><p><strong>Supply Chain Disruptions: </strong>General supply chain issues, such as delays and logistical constraints, further exacerbate the uncertainty in salt availability.</p></li><li><p><strong>Aging Domestic Mines: </strong>Both the United States and Canada are grappling with aging salt mines. This not only affects the volume of domestically produced salt but also raises concerns about the long-term sustainability of these mines.</p></li></ul><h2 id="salt-mining-a-path-to-north-american-security"><a href="#salt-mining-a-path-to-north-american-security">#</a>Salt Mining: A Path to North American Security</h2><p><strong>Atlas Salt Inc.</strong> (TSXV: SALT) (OTCQB: REMRF) is bringing North American investors a <a href="https://www.valuethemarkets.com/analysis/market-reports-guides/reports/why-consider-investing-in-atlas-salt-stock?utm_source&#61;ig1&amp;utm_medium&#61;website&amp;utm_campaign&#61;as001&amp;utm_content&#61;text-link" target="_blank">unique opportunity to invest in a defensive mining stock</a>. The Great Atlantic Salt Project is the first new underground salt mine in North America in over 20 years, strategically located near key markets with excellent infrastructure including roads, a deep-water port, and access to high-voltage power. This reduces transportation costs and positions Great Atlantic as a low-cost, long-life producer of salt.</p><p>Furthermore, competing mines have aging assets, and international suppliers can be displaced on distance and carbon emissions, with Great Atlantic expected to be one of the world’s lowest greenhouse gas mining projects.</p><p>De-icing road salt is the biggest single individual market for salt in North America, and Atlas’ Great Atlantic Salt Project is situated right where it’s needed most. Salt is a non-cyclical commodity and a truly defensive investment. Best of all, an efficient salt mine drives incredible long-term free cash flow.</p><p>A comprehensive feasibility study, greenhouse gas emissions survey, and both environmental and economic assessments have confirmed the viability of the Great Atlantic Salt Project. With these milestones achieved, pre-construction development is now actively progressing.</p><p>Intrigued by this defensive growth stock? Amid the cyclicality of the mining sector, Atlas Salt stands out. </p><div class="inline-flex flex-wrap items-center justify-start gap-4 my-4 not-prose">
    <a style="background: #292F3A;
            color: #0FF288;
       " class="inline-flex items-center justify-center rounded-full bg-[#BFF257] px-6 py-3 text-sm font-bold text-[#031011] transition-all hover:brightness-90 focus:outline-none focus:ring-2 focus:ring-[#031011]/20" href="https://www.valuethemarkets.com/analysis/market-reports-guides/reports/why-consider-investing-in-atlas-salt-stock?utm_source&#61;ig1&amp;utm_medium&#61;website&amp;utm_campaign&#61;as001&amp;utm_content&#61;final-cta-btn">
            Explore the Atlas Salt Opportunity
    </a>
</div>
<p></p><p><strong><small>Sources</small></strong></p><ol start="1"><li><p><small>Observatory of Economic Complexity. Salt, Sodium Chloride (Including Solution Salt Water), 2023.<a href="https://oec.world/en/profile/hs/salt-sodium-chloride-including-solution-salt-water"> <u>https://oec.world/en/profile/hs/salt-sodium-chloride-including-solution-salt-water</u></a></small></p></li><li><p><small>Atlas Salt. Market Opportunity. <a href="https://atlassalt.com/market/"><u>https://atlassalt.com/market/</u></a></small></p></li></ol>
                ]]>
            </content>
                                                <category term="Investing Data Stories" />
            
            <published>2024-11-04T00:00:00+00:00</published>
            <updated>2026-03-16T04:52:05+00:00</updated>
        </entry>
            <entry>
            <title><![CDATA[Stock Market Trends 2024: S&amp;P 500&#039;s Winners &amp; Losers]]></title>
            <link rel="alternate" href="https://www.valuethemarkets.com/investing-data-story/stock-market-trends-2024-sp-500s-winners-losers" />
            <id>https://www.valuethemarkets.com/18827</id>
            <author>
                <name><![CDATA[Kirsteen Mackay]]></name>
                        <email><![CDATA[kirsteen.mackay@digitonic.co.uk]]></email>
                    </author>
            <summary type="html">
                <![CDATA[The S&P 500 gained 23.3% in 2024, driven by AI growth and mega-caps like Nvidia. Uneven gains exposed sector weaknesses, from retail to healthcare.]]>
            </summary>
                        <content type="html">
                <![CDATA[
                                        <p><a href="https://www.valuethemarkets.com/investing-data-story/stock-market-trends-2024-sp-500s-winners-losers"><img alt="Stock Market Trends 2024: S&amp;P 500&#039;s Winners &amp; Losers" src="https://www.valuethemarkets.com/curator/media/2024-biggest-winners-losers-in-sp50.jpg?fm=webp&amp;q=80&amp;s=709835f8b9f7f138caa787dcd36fc1d6" /></a></p>
                                        <p></p><div>
                <figure class>
                            <img src="/curator/media/chart-2024-biggest-winners-losers-in-sp500.jpg?fm&#61;webp&amp;q&#61;80&amp;s&#61;01d0151f9287399590d335466e403061" alt="Chart of 2024 Biggest Winners &amp; Losers in S&amp;P500" width="1200" height="1689" />
                                        </figure>
    </div>
<p></p><p>The S&amp;P 500 delivered impressive returns in 2024, climbing over 20%<sup>1</sup> for the second consecutive year. This strong performance reinforced investor confidence, but a closer look reveals that the rally was far from evenly distributed. A handful of mega-caps were the primary drivers of these gains. Often referred to as the &#34;Magnificent Seven Stocks,&#34; these include Apple, Microsoft, Alphabet, Amazon, Nvidia, Tesla, and Meta. While their outsized contributions boosted the index, they also highlighted a growing disparity between these tech giants and the rest of the market<sup>2</sup>. </p><p>Despite this imbalance, not all seven ranked among the S&amp;P 500’s share price winners for 2024. This article takes a closer look at the year&#039;s dynamics, analyzing the 10 best and worst-performing stocks in the index. By examining these extremes, we uncover the trends and challenges that defined the market, highlighting where investors found opportunities and where pitfalls emerged.</p><h2 id="top-ten-sp-500-stocks-2024"><a href="#top-ten-sp-500-stocks-2024">#</a>Top Ten S&amp;P 500 Stocks 2024</h2><p>The two Magnificent Seven stocks that appear in the S&amp;P 500’s top ten winners of 2024 include <strong>NVIDIA Corp</strong> (NASDAQ: NVDA) and <strong>Netflix Inc</strong> (NASDAQ: NFLX). Accompanying them are <strong>United Airlines Holdings Inc</strong> (NASDAQ: UAL),  <strong>GE Vernova Inc</strong> (NYSE: GEV), <strong>Axon Enterprise Inc</strong> (NASDAQ: AXON), <strong>Broadcom Inc</strong> (NASDAQ: AVGO), <strong>Targa Resources Corp</strong> (NYSE: TRGP), <strong>Howmet Aerospace Inc</strong> (NYSE: HWM), <strong>Constellation Energy Corp</strong> (NASDAQ: CEG), and <strong>Arista Networks Inc</strong> (NYSE: ANET).</p><p>NVIDIA soared by 171.25%<sup>3</sup> in 2024, driven by the explosive growth in demand for its AI chips used in everything from data centers to autonomous vehicles. United Airlines also took flight, posting a 135.34% gain fueled by strong travel demand, an increase in corporate travel, and impressive earnings results.</p><p>GE Vernova, a spinoff of General Electric, began trading on the NYSE in April 2024. During the year, GE Vernova achieved record orders and revenue growth, driven by strong demand in its Power and Electrification segments, leading to significant margin expansion and increased cash generation. The GEV share price climbed 131.78 % during 2024.</p><p>A beneficiary of public safety concerns, Axon Enterprise, saw its share price climb 130.06% last year, fueled by its pivot to AI-driven solutions and global expansion. Once known for tasers and body cameras, Axon now leads in public safety technology with innovations like Redaction Assistant and drone tracking systems. A major contract with the Royal Canadian Mounted Police underscores its international growth. As demand for AI tools in law enforcement surges, Axon’s advanced offerings and strong financial performance position it for sustained growth, solidifying its role as a leader in public safety innovation.</p><p>Broadcom delivered a robust 110.49% share price return, bolstered by strong demand for its semiconductors. The company achieved a record revenue of $51.6 billion, driven by the integration of VMware, 220% growth in AI-related semiconductor sales, and strong profitability.</p><p>Targa Resources benefited from rising energy prices which increased demand for its midstream services and improved margins on NGL sales. This price environment, along with strategic investments in high-demand infrastructure and operational efficiency, contributed to its financial performance and a  110.12% share price increase during the year.</p><p>Howmet Aerospace&#039;s share price rose by 102.71% in 2024, driven by strong revenue growth, particularly in commercial aerospace, alongside improved profitability and operational efficiency. Share repurchases and a dividend increase bolstered investor confidence, supported by the aviation industry&#039;s recovery and solid performance across key markets, including aerospace and industrial sectors.</p><p>Constellation Energy delivered a 92.71% return, benefiting from a 20-year power purchase agreement with Microsoft to supply clean energy for data centers. Arista Networks enjoyed strong financial performance driving its stock 87.73% higher. The surge in demand for high-performance networking equipment to support artificial intelligence (AI) applications, especially from major clients like Meta Platforms and Microsoft, also supported the price rise. </p><p>Netflix stock did well in 2024 due to popular content releases, such as Squid Game season 2 and successful live events, including NFL games on Christmas Day. The NFLX share price rose 83.07% in 2024.</p><h2 id="palantirs-brief-appearance-in-the-sp-500"><a href="#palantirs-brief-appearance-in-the-sp-500">#</a>Palantir’s Brief Appearance in the S&amp;P 500</h2><p>You may wonder why Palantir isn’t ranked at number one, given its remarkable 394% rise in 2024. However, it only featured in the S&amp;P 500 briefly from late September to late November 2024 before being removed following its transition from the NYSE to the NASDAQ. During its time in the index, Palantir&#039;s stock climbed approximately 73%, which would place it at 16th among the S&amp;P 500’s top performers.</p><h2 id="underperforming-stocks-in-the-sp-500"><a href="#underperforming-stocks-in-the-sp-500">#</a>Underperforming Stocks in the S&amp;P 500</h2><p>The worst-performing S&amp;P 500 stocks in 2024 were <strong>Super Micro Computer Inc</strong> (NASDAQ: SMCI), <strong>Walgreens Boots Alliance Inc</strong> (NASDAQ: WBA), <strong>Intel Corp</strong> (NASDAQ: INTC), <strong>Moderna Inc</strong> (NASDAQ: MRNA), <strong>Celanese Corp</strong> (NYSE: CE), <strong>Enphase Energy Inc</strong> (NASDAQ: ENPH), <strong>Estee Lauder Cos Inc</strong> (NYSE: EL), <strong>Dollar Tree Inc</strong> (NASDAQ: DLTR), <strong>Humana Inc</strong> (NYSE: HUM), and <strong>Dollar General Corp</strong> (NYSE: DG).</p><p>Super Micro Computer faced a difficult year in 2024, with its stock plunging 71.48%. The decline was primarily due to concerns over its financial reporting and corporate governance. Allegations of accounting manipulation by a short-seller and the resignation of its auditor raised serious investor concerns.</p><p>Walgreens&#039; stock declined by 61.34% due to shrinking demand for COVID-19 vaccines, heightened competition, and operational challenges. Dividend cuts, store closures, and legal issues further eroded investor confidence.</p><p>Intel&#039;s stock fell 59.57% in 2024 due to CPU instability issues, a weak Arrow Lake launch, market share losses to AMD, and layoffs amid financial struggles. Its removal from the Dow Jones Industrial Average and CEO Pat Gelsinger&#039;s retirement added to uncertainty.</p><p>Moderna saw its stock drop 58.19% as demand for its COVID-19 vaccine tapered off and it implemented cost-cutting measures affecting some of its pipeline programs. Celanese experienced a 54.57% decline due to weaker demand for its chemical products amid a slowing global economy and rising input costs. Enphase Energy also struggled, with its stock down 48.02%, as the solar energy market experienced volatility.</p><p>Estee Lauder faced challenges in the luxury cosmetics market as it succumbed to market weakness in Asia, with its stock dropping 47.59%. Dollar Tree fell 47.24% as inflation and shifting consumer habits reduced spending.</p><p>Read more about what <a href="https://www.valuethemarkets.com/analysis/tracking-us-consumer-spending-trends-for-investor-insights">shaped consumer spending trends from 2020 to 2024</a>.</p><p>Humana saw its stock decline by 43.96%, reflecting concerns about rising healthcare costs and growing competition in the managed care sector. Finally, Dollar General faced a similar fate, with its stock falling 43.12% as inflation and increased competition from discount rivals weighed on its performance.</p><h2 id="mega-caps-prove-to-be-a-driving-force"><a href="#mega-caps-prove-to-be-a-driving-force">#</a>Mega-Caps Prove to Be a Driving Force</h2><p>The Magnificent Seven drove the S&amp;P 500&#039;s gains due to their substantial weight in the index. These mega-cap stocks hold outsized influence because the S&amp;P 500 is weighted by market capitalization. Even moderate price increases in these companies significantly impact the index&#039;s overall performance. While not all seven ranked among the top gainers by share price percentage, their collective market value was large enough to account for a significant portion of the index&#039;s growth. This shows how a few dominant companies can heavily influence the index, even if most other stocks perform differently.</p><p>Discover the <a href="https://www.valuethemarkets.com/analysis/tech-insiders-cash-in-on-stock-market-boom-with-major-share-sales">Insiders at top tech companies selling their shares in 2024</a>.</p><h2 id="stock-market-trends-2024"><a href="#stock-market-trends-2024">#</a>Stock Market Trends 2024</h2><p>The stock market in 2024 displayed a strong but uneven performance, with the S&amp;P 500 gaining 23.3%<sup>1</sup>. This marked a second year of impressive performance after rising 24.2%<sup>1</sup> in 2023.</p><p><a href="https://www.valuethemarkets.com/analysis/investing-ideas/investing-in-ai-stocks-beginners-guide">Artificial intelligence</a> continued as a key growth driver, boosting demand for AI-related products and services across multiple sectors. Clean energy and aerospace also gained momentum, supported by sustainability initiatives and a recovering travel market.</p><p>Conversely, some sectors faced significant challenges. Retailers and healthcare companies struggled with inflation, shifting consumer habits, and rising costs, while semiconductor firms faced mixed fortunes in 2024. Broader market disparities emphasized opportunities in emerging technologies and clean energy while exposing vulnerabilities in traditional retail and healthcare industries.</p><p>The market&#039;s focus on innovation, sustainable growth, and post-pandemic recovery underscored evolving investor priorities, but the uneven distribution of gains signaled potential risks in relying on a narrow set of outperformers.</p><p></p>
                ]]>
            </content>
                                                <category term="Investing Data Stories" />
            
            <published>2025-01-27T15:23:01+00:00</published>
            <updated>2026-03-16T04:55:43+00:00</updated>
        </entry>
    </feed>