Visualized: Natural Gas Price Gaps Reshape Global Energy Trade

By Kirsteen Mackay

May 08, 2026

5 min read

Global gas benchmarks show a wide price gap, with North America far below Europe and Asia, shaping trade, margins, and energy stocks.


Sponsored by: CanCambria Energy. European gas supply remains constrained, with pricing consistently above North American benchmarks. CanCambria is targeting this gap with a large-scale tight gas project in southern Hungary. Access our Exclusive Investor Report on CanCambria Energy.

#Global Gas Prices Show A Wide Regional Split

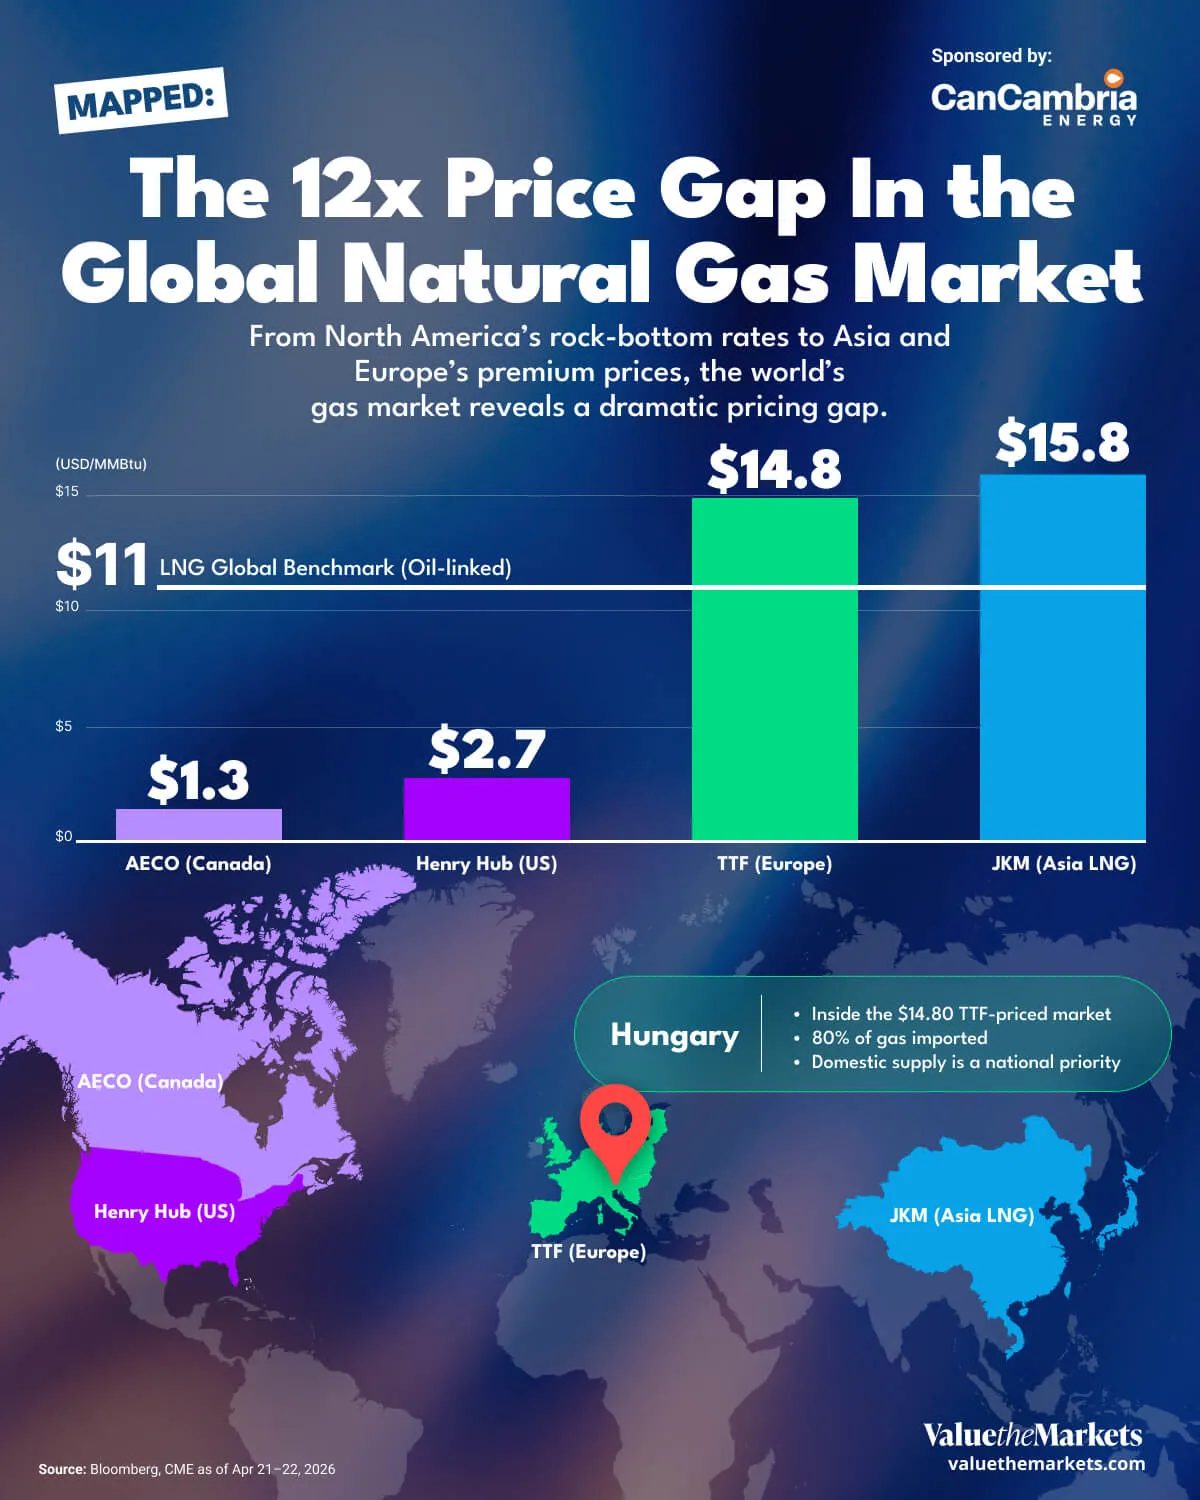
Recent benchmark data shows a global gas market that is still deeply fragmented. As of late April 2026, Henry Hub in the US sits at $2.70 per MMBtu, while AECO in Canada is even lower at $1.30. In Europe, TTF stands at $14.80, and in Asia, JKM is $15.80. Oil linked LNG contracts are estimated around $11 to $13. That vast spread between North American and European benchmarks is not a quirk of seasonality. It reflects a market under structural stress, shaped by a Middle East conflict, constrained infrastructure, and a cargo routing battle playing out across the Atlantic and Pacific basins.

The key takeaway is simple. Gas is not one global price. It is a set of regional prices shaped by pipeline limits, LNG export capacity, storage levels, weather, and contract structure. That helps explain why a producer in Alberta faces a very different market than an LNG seller targeting Asia.

Benchmark

Price

Note

Henry Hub (US):

$2.70

Sourced from NYMEX front-month futures1

AECO (Canada)

$1.30

Alberta hub spot2, converted from CAD$1.70/GJ

TTF (Europe)

$14.80

Front-month Dutch TTF3, converted from €42.92/MWh

JKM (Asia LNG)

$15.80

CME front-month swap linked to Platts JKM4 (~$15.80/MMBtu, Apr 21, 2026), used as proxy for Asian spot LNG

Oil-linked LNG (global)

$11–$13

Oil-linked LNG price: calculated from long-term supply contracts where LNG is priced as a fixed percentage of the Brent crude oil price5, not a live market quote.

Prices approximate as of April 21-22, 2026

#Five Things Investors Should Know

  1. The spread between regions is structural, not seasonal. North American prices are low because production is abundant and export capacity is finite. European and Asian prices are high because those regions depend on imports, and import-dependent markets pay a premium for supply security.

  2. Low North American prices create winners and losers. Henry Hub at $2.70 and AECO at $1.30 weigh on upstream producers with limited pipeline access. But they benefit LNG exporters buying cheap feedgas, gas-fired utilities, and petrochemical producers.

  3. Europe pays a structurally elevated price for imported gas. TTF at $14.80 reflects declining domestic output and a sustained shift toward LNG imports. That premium has been a consistent feature of European gas markets since 2021 and the underlying supply constraints have not been resolved.

  4. Contract structure shapes how benchmark prices translate to earnings. Many LNG deals are indexed to oil rather than spot gas. At $11-13 per MMBtu, oil-linked contracts sit below current TTF and JKM levels, meaning revenue can lag when spot prices spike.

  5. European storage trajectory is a key risk variable. When storage enters winter below the five-year average, the market becomes more sensitive to cold weather. That sensitivity tends to keep prices elevated and volatile through the heating season.

#North America Is Oversupplied, Europe Is Not

Henry Hub at $2.70 reflects a market where production is running ahead of export capacity. AECO's deeper discount reflects additional pipeline constraints in Western Canada that directly compress producer margins. That cheap feedgas is precisely what makes North American LNG export projects attractive to buyers in higher-priced markets overseas.

Europe's situation is the inverse. Domestic output has been in structural decline for over a decade. The region has responded by building LNG import capacity and competing on global spot markets. A gas project producing within Europe avoids that import chain entirely, supplying into a market that is structurally short, pays premium prices, and has strong policy incentives to support local production.

#Asia and Oil-Linked Contracts Round Out the Picture

JKM at $15.80 reflects Asia's heavy reliance on imported LNG, with limited pipeline alternatives and less storage capacity relative to demand. Prices are high but more volatile than TTF, driven by weather, shipping constraints, and cargo routing decisions.

Oil-linked LNG at $11-13 sits above North American benchmarks but below current spot levels in Europe and Asia. Because these contracts typically price off Brent with a multi-month lag, sellers do not capture the full upside when spot prices spike. Contract mix shapes cash flow timing and earnings predictability in ways that matter when comparing LNG-exposed companies.

The regional gaps visible in this data reflect years of underinvestment in European domestic supply and growing import dependency across Asia, and they are not expected to close quickly.

#CanCambria Targets Europe’s Gas Gap

CanCambria Energy Corp. (TSXV: CCEC) (OTCQB: CCEYF) (FSE: 4JH) is advancing its 100%-owned Kiskunhalas tight-gas project in southern Hungary, targeting a structurally tight European gas market where domestic supply remains constrained and prices trade well above North American benchmarks6.

The company’s flagship project is built around a large, independently evaluated gas-condensate resource in the Pannonian Basin. Historical wells, modern seismic and legacy production data confirm a proven hydrocarbon system.

CanCambria’s near-term strategy is focused on funding and drilling an initial three-well appraisal program, with first wells targeted for late 2026 and first gas sales expected in early 2027. At US$4/MMBtu, the breakeven gas price for the CanCambria project, compares favorably to the current European gas price.The project benefits from proximity to existing pipeline infrastructure, potentially shortening the path from first flow to revenue if initial results support the development model.

The company has also identified a shallow 350 km² high-impact exploration trend within the Kiskunhalas Concession Area. Multiple leads and prospects have emerged from legacy 2D seismic across a basin that has produced more than 160 million BOE, adding potential lower-cost, faster-cycle upside alongside the deeper tight-gas opportunity.

CEO and President Dr. Paul Clarke commented7:

Hydrocarbon discoveries are commonly made by applying new exploration technologies within proven basins, and that is exactly the opportunity we see emerging at Kiskunhalas. 

While we remain focused on the deep tight gas resource development, we are increasingly encouraged by the shallow fairway now being defined across the northern KCA. These targets could support lower-cost, faster-cycle drilling and the potential for multiple satellite accumulations along a broader trend.

#Learn more about CanCambria Energy →

Important Notice And Disclaimer

PAID ADVERTISEMENT

This communication is a paid advertisement. ValueTheMarkets is a trading name of Digitonic Ltd, and its owners, directors, officers, employees, affiliates, agents and assigns (collectively the “Publisher”) is often paid by one or more of the profiled companies or a third party to disseminate these types of communications. In this case, the Publisher has been compensated by CanCambria Energy Corp to conduct investor awareness advertising and marketing and has paid the Publisher the equivalent of thirty thousand US dollars starting April 12th, 2026 to July 11th, 2026 to produce and disseminate this and other similar articles and certain related banner advertisements. This compensation should be viewed as a major conflict with the Publisher’s ability to provide unbiased information or opinion.

CHANGES IN SHARE TRADING AND PRICE

Readers should beware that third parties, profiled companies, and/or their affiliates may liquidate shares of the profiled companies at any time, including at or near the time you receive this communication, which has the potential to adversely affect share prices. Frequently, companies profiled in our articles experience a large increase in share trading volume and share price during the course of investor awareness marketing, which often ends as soon as the investor awareness marketing ceases. The investor awareness marketing may be as brief as one day, after which a large decrease in share trading volume and share price may likely occur.

NO OFFER TO SELL OR BUY SECURITIES

This communication is not, and should not be construed to be, an offer to sell or a solicitation of an offer to buy any security.

INFORMATION

Neither this communication nor the Publisher purport to provide a complete analysis of any company or its financial position. This communication is based on information that is publicly available and on information provided by the company or its authorised representatives. It does not contain any material, non-public information. While the information contained in these materials is believed to be accurate and reliable, the Company, its affiliates, nor their respective members, owners, partners, principals, managers, employees, agents or representatives makes any warranty or representation, whether express or implied, or assumes any legal liability for the accuracy or completeness of any information contained in these materials. Certain information contained herein is based on data provided by third-party sources and, although believed to be reliable, has not been independently verified and its accuracy or completeness cannot be guaranteed and should not be relied upon as such. The financial information contained herein has not been audited and is not necessarily indicative of future results. Further, the Publisher does not guarantee the accuracy or completeness of the information. The information in this communication is not updated after publication and may become inaccurate or outdated. Any statements made should not be taken as an endorsement of analyst views.

NO FINANCIAL ADVICE

The Publisher is not, and does not purport to be, a broker-dealer or registered investment adviser or a financial adviser. The Publisher has no access to non-public information about publicly traded companies. The information provided is general and impersonal, and is not tailored to any particular individual’s financial situation or investment objective(s) and this communication is not, and should not be construed to be, personalized investment advice directed to or appropriate for any particular investor or a personal recommendation to deal or invest in any particular company or product. Any investment should be made only after consulting a professional investment advisor and only after reviewing the financial statements and other pertinent corporate information about the company. Further, readers are advised to read and carefully consider the Risk Factors identified and discussed in the advertised company’s SEC, SEDAR+ and/or other government filings. Investing in securities, particularly microcap securities, is speculative and carries a high degree of risk. Past performance does not guarantee future results.

FORWARD LOOKING STATEMENTS

This communication contains forward-looking statements, including statements regarding expected continual growth of the featured companies and/or industry. Statements in this communication that look forward in time, which include everything other than historical information, are based on assumptions and estimates by our content providers and involve risks and uncertainties that may affect the profiled company’s actual results of operations. These statements are not guarantees of future performance and undue reliance should not be placed on them. These statements involve known and unknown risks, uncertainties and other important factors that could cause the actual results and performance to differ materially from any future results or performance expressed or implied in the forward-looking statements. These risks, uncertainties and other factors include, among others: the success of the profiled company’s operations; the size and growth of the market for the company’s products and services; the company’s ability to fund its capital requirements in the near term and long term; pricing pressures; changes in business strategy, practices or customer relationships; general worldwide economic and business conditions; currency exchange and interest rate fluctuations; government, statutory, regulatory or administrative initiatives affecting the company’s business. The Company nor the Publisher undertakes any obligation to update forward-looking statements if circumstances or estimates or opinions should change.

INDEMNIFICATION/RELEASE OF LIABILITY

By reading this communication, you acknowledge that you have read and understand this disclaimer in full, and agree and accept that the Publisher and the Company provide no warranty in respect of the communication or the profiled company and accepts no liability whatsoever. You acknowledge and accept this disclaimer and that, to the greatest extent permitted under applicable law, you release and hold harmless the Publisher and the Company from any and all liability, damages, injury and adverse consequences arising from your use of this communication. You further agree that you are solely responsible for any financial outcome related to or arising from your investment decisions.

TERMS OF USE AND DISCLAIMER

By reading this communication you agree that you have reviewed and fully agree to the Terms of Use found here https://www.valuethemarkets.com/terms-conditions/ and acknowledge that you have reviewed the Disclaimer found here https://www.valuethemarkets.com/disclaimer/. If you do not agree to the Terms of Use, please contact valuethemarkets.com to discontinue receiving future communications.

INTELLECTUAL PROPERTY

All trademarks used in this communication are the property of their respective trademark holders. Other than valuethemarkets.com, the Publisher is not affiliated, connected, or associated with, and the communication is not sponsored, approved, or originated by, the trademark holders unless otherwise stated. No claim is made by the Publisher to any rights in any third-party trademarks other than valuethemarkets.com.

AUTHORS: VALUETHEMARKETS

valuethemarkets.com and Digitonic Ltd and our affiliates are not responsible for the content or accuracy of this article. The information included in this article is based solely on information provided by the company or companies mentioned above. This article does not provide any financial advice and is not a recommendation to deal in any securities or product. News and research are not recommendations to invest in the Company, and investments may fall in value so that you could lose some or all of your investment. Past performance is not an indicator of future performance. ValueTheMarkets does not hold any position in the stock(s) and/or financial instrument(s) mentioned in the above piece. ValueTheMarkets have been paid to produce this piece by the company or companies mentioned above. Digitonic Ltd, the owner of valuethemarkets.com, has been paid for the production of this piece by the company or companies mentioned above.